Modeling Photosynthetic Responses to Carbon Dioxide
Modeling Photosynthetic Responses to Carbon Dioxide


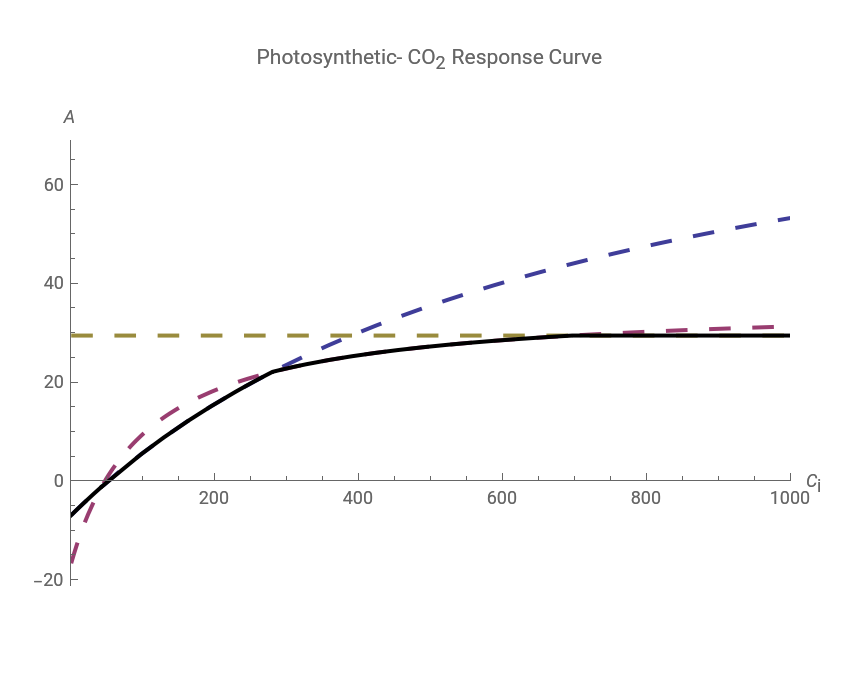
This Demonstration simulates the response of photosynthesis () to the intercellular concentration of (). The equations are based on the leaf model of photosynthesis[1] that predicts based on the most limiting of three processes: (1) the kinetics of ribulose-1,5-bisphosphate (RuBP) carboxylase/oxygenase (or rubisco) for fixing , (2) the rate of RuBP regeneration associated with electron transport rates on the thylakoid membrane (RuBP), and (3) the rate in which inorganic phosphate, required for regenerating ATP from ADP, is released during the utilization of triose phosphate (TPU). While the functions associated with all three of these limiting processes are shown (Rubisco, RuBP, and TPU), the actual modeled rate of photosynthesis is the lowest of the three processes, with the exception of the portion of the curve below the intersection of rubisco and RuBP limited photosynthesis. Below this intersection, photosynthesis will always be rubisco-limited. The modeled rates of photosynthesis are indicated by the net photosynthesis curve (solid black line). Vary the parameters or environmental conditions to see the impact on the modeled photosynthesis over the range of . Temperature has a major effect on photosynthesis, and the equations from the original model[1] have been corrected with the temperature functions from[3] for rubisco-limited photosynthesis,[2, 4, 6] for RuBP-limited photosynthesis, and[5] for TPU-limited photosynthesis.
A
µmol
-2
m
-1
s
CO
2
C
i
μmol
-1
mol
A
CO
2
A
C
i
Details
Details
The leaf's environmental conditions include leaf temperature (°C), oxygen concentration (), and photosynthetic photon flux density ().
T
leaf
O
2
mmol
-1
mol
PPFD
µmol
-2
m
-1
s
The photosynthetic parameters include the maximum rate of carboxylation (), maximum rate of electron transport through photosystem II (), rate of triose phosphate utilization (), and rate of mitochondrial respiration ().
V
c,max
µmol
-2
m
-1
s
J
max
µmol
-2
m
-1
s
TPU
µmol
-2
m
-1
s
R
d
µmol
-2
m
-1
s
The temperature dependence of is derived using the data from[2] but with the temperature response of[6] modified as in[4] to normalize values to . Under under the heading "RuBP-Limited Adjustments", you can vary the temperature optimum and the temperature at which falls to of its value at (). The default parameterization for these values are from[2] for tobacco grown at 25 °C, but values for a range of species are provided elsewhere[6]. Changes in and only affect when ≠25°C. You can also vary the leaf absorbance (unitless), the ratio of photosystem II to photosystem I (unitless), the curvature of the PPFD response curve (unitless), and the quantum efficiency of PSII (unitless).
J
max
25°C
A
T
o
J
max
-1
e
T
o
Ω
T
o
Ω
A
T
leaf
α
β
Θ
Φ
PSII
References
References
[1] G. D. Farquhar, S. von Caemmerer, and J. A. Berry, "A Biochemical Model of Photosynthetic Assimilation in Leaves of Species," Planta, 149(1), 1980 pp. 78–90. doi:10.1007/BF00386231.
CO
2
C
3
[2] C. J. Bernacchi, C. Pimentel, and S. P. Long, "In Vivo Temperature Response Functions of Parameters Required to Model RuBP-Limited Photosynthesis," Plant, Cell & Environment, 26(9), 2003 pp. 1419–1430. doi:10.1046/j.0016-8025.2003.01050.x.
[3] C. J. Bernacchi, E. L. Singsaas, C. Pimentel, A. R. Portis Jr, and S. P. Long, "Improved Temperature Response Functions for Models of Rubisco-Limited Photosynthesis," Plant, Cell & Environment, 24(2), 2001 pp. 253–259. doi:10.1111/j.1365-3040.2001.00668.x.
[4] C. J. Bernacchi, C. J. Bagley, S. P. Serbin, U. M. Ruiz-Vera, D. M. Rosenthal, and A. VanLoocke, "Modeling C3 Photosynthesis from the Chloroplast to the Ecosystem," Plant, Cell & Environment, 24(2), 2013 pp. 1641–1657. doi: 10.1111/pce.12118.
[5] P. C. Harley, R. B. Thomas, J. F. Reynolds, and B. R. Strain, "Modelling Photosynthesis of Cotton Grown in Elevated ," Plant, Cell & Environment, 15(3), 1992 pp. 271–282. doi:10.1111/j.1365-3040.1992.tb00974.x.
CO
2
[6] T. June, J. R. Evans, and G. D. Farquhar, "A Simple New Equation for the Reversible Temperature Dependence of Photosynthetic Electron Transport: A Study on Soybean Leaf," Functional Plant Biology 31(3), 2004 pp. 275–283. doi:10.1071/FP03250.
Permanent Citation
Permanent Citation
Carl J. Bernacchi, Justin E. Bagley, Shawn P. Serbin, Ursula M. Ruiz-Vera, David M. Rosenthal, Andy VanLoocke
"Modeling Photosynthetic Responses to Carbon Dioxide"
http://demonstrations.wolfram.com/ModelingPhotosyntheticResponsesToCarbonDioxide/
Wolfram Demonstrations Project
Published: March 13, 2013