The wave equation is a linear second order partial differential equation that describes the propagation of waves. In its two - dimensional form, it contains a time variable , two spatial variables and a function of these variables, u, that describes the displacement of a medium through which waves are propagating over time . That the wave equation is linear implies that its solution can consist of the sum of any number of solutions . This is observed in nature as the superposition principle wherein waves add constructively and destructively when occupying the same space . Using Fourier series to model wave behavior in a two - dimensional membrane is, then, appropriate in that the sums of sines and cosines can be used to approximate the total displacement of the membrane over its surface area . The solution of the two - dimensional wave equation for a rectangular membrane that is fixed at its boundaries can be found through separation of variables and the application of both boundary conditions and initial conditions, and expressed as a double Fourier series . From the solution, the behavior of the membrane as waves propagate through it can then be explored by introducing an initial displacement and/or initial velocity in its surface .
(t)
(x,y)
2 - D Wave Equation in Cartesian Coordinates
2 - D Wave Equation in Cartesian Coordinates
The wave equation for a two - dimensional rectangular membrane with boundary and initial conditions is expressed as
u
tt
2
c
u
xx
L
x
L
y
u(0,y,t)u(,y,t)0, t≥0
L
x
u(x,0,t)u(x,,t)0, t≥0
L
y
u(x,y,0)f(x,y), (x,y)g(x)0≤x≤, 0≤y≤
u
t
L
x
L
y
where u(x, y, 0) and u t (x, y, 0) are the initial displacement and velocity of a membrane fixed at its edges. c is the propagation velocity of the wave, or the square root of the tension per length of the membrane dividedby its surface density while and are the lengths of the membrane in the and directions,respectively.This model assumes no external forces or damping.
T
ρ
L
x
L
y
x
y
Solving the Wave Equation
Solving the Wave Equation
Using the method of separation of variables we could calculate the general solution, as follows
u(x,y,t)=sinsincos+t
∞
∑
n=1
∞
∑
m=1
a
nm
nπx
L
mπy
L
cπ
L
2
n
2
m
a
nm
4
2
L
L
∫
0
L
∫
0
nπx
L
mπy
L
Running the following code on Mathematica will produce the solution of the problem
In[]:=
Clear["Global`*"]c=1;L=1;
(*Definitionoffunctionsf(x,y)andg(x,y)*)
In[]:=
f[x_,y_]:=Sin*Sing[x_,y_]:=0μ[n_]=;κ[m_]=;λ[n_,m_]=μ[n]+κ[m];ω[n_,m_]=c**Sin
n*π*x
2
m*π*y
3
2
(n*π)
2
(m*π)
λ[n,m]
//SimplifyU[n_,m_]=Sinn*π*x
L
m*π*y
L
Out[]=
2
m
2
n
Out[]=
Sin[nπx]Sin[mπy]
(*ComputationoftheFouriercoefficients*)
In[]:=
A[n_,m_]=f[x,y]*U[n,m]xyB[n_,m_]=*ω[n,m]g[x,y]*U[n,m]xy
4
2
L
L
∫
0
L
∫
0
4
2
L
L
∫
0
L
∫
0
Out[]=
16Cos
mπ
3
3
Sin
mπ
3
3
Sin
nπ
2
mn
2
π
Out[]=
0
(*Thegeneralsolutionofourproblem*)
In[]:=
T[n_,m_]=A[n,m]*Cos[ω[n,m]*t]+B[n,m]*Sin[ω[n,m]*t]
Out[]=
16CosCos+t
mπ
3
2
m
2
n
3
Sin
mπ
3
3
Sin
nπ
2
mn
2
π
In[]:=
u1[x,y,t]=(A[n,m]*Cos[ω[n,m]*t]+B[n,m]*Sin[ω[n,m]*t])*Sin[(n*π*x)/L]*Sin[(m*π*y)/L]
Out[]=
16CosCos+tSin[nπx]Sin[mπy]
mπ
3
2
m
2
n
3
Sin
mπ
3
3
Sin
nπ
2
mn
2
π
In[]:=
u[x_,y_,t_,l_,k_]:=
l
∑
n=1
k
∑
m=1
16CosCos+tSin[nπx]Sin[mπy]
mπ
3
2
m
2
n
3
Sin
mπ
3
3
Sin
nπ
2
mn
2
π
In[]:=
u[x,y,t,1,1]//TraditionalFormu[x,y,t,1,2]//TraditionalFormu[x,y,t,2,2]//TraditionalFormu[x,y,t,3,3]//TraditionalForm
Out[]//TraditionalForm=
3
3
cos(2
t)sin(πx)sin(πy)2
π
Out[]//TraditionalForm=
3
3
cos(2
t)sin(πx)sin(πy)2
π
3
3
cos(5
t)sin(πx)sin(2πy)2
2
π
Out[]//TraditionalForm=
3
3
cos(2
t)sin(πx)sin(πy)2
π
3
3
cos(5
t)sin(πx)sin(2πy)2
2
π
Out[]//TraditionalForm=
3
3
cos(2
t)sin(πx)sin(πy)2
π
3
cos(10
t)sin(3πx)sin(πy)2
π
3
3
cos(5
t)sin(πx)sin(2πy)2
2
π
3
cos(13
t)sin(3πx)sin(2πy)2
2
π
We plot snapshots for the last case
We plot snapshots for the last case
In[]:=
graphs=TableParametricPlot3D[{x,y,u[x,y,t,3,3]},{x,0,2},{y,0,3},AxesFalse,BoxedFalse,BoxRatios{1,1,1},ImageSize600,BoundaryStyleDirective[Red,Thick],ColorFunction"MintColors",PlotRangeAll],t,0,2,;p1=Partition[graphs,3];Show[GraphicsGrid[p1]]
1
4
Out[]=
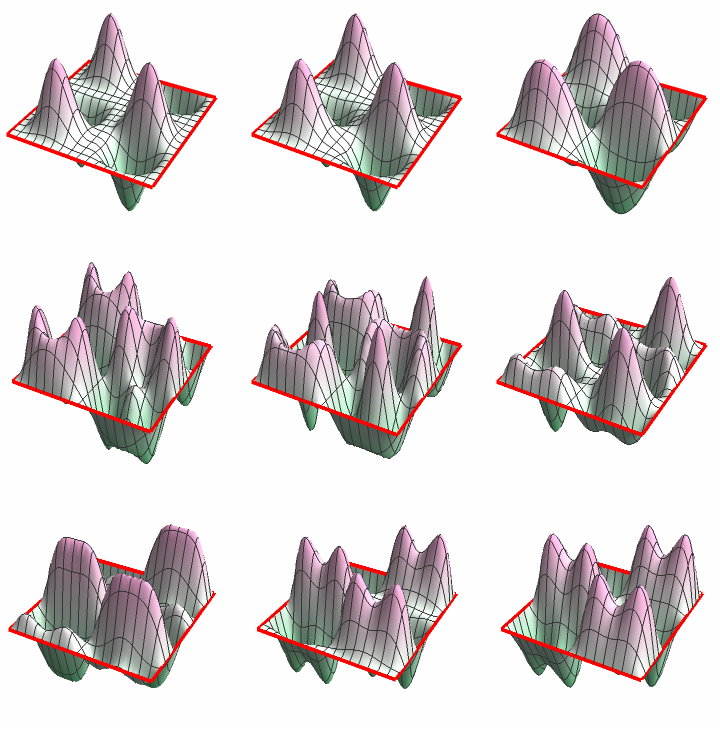
(*Createa3Dplotforthegivenvalues*)
In[]:=
Plot3D[u[x,y,1,3,3],{x,0,2},{y,0,3},PlotRange->All,AxesLabel->{"x","y","u"},Mesh->None,BoxRatios->{1,1,1},ColorFunction->"Rainbow"]
Out[]=
