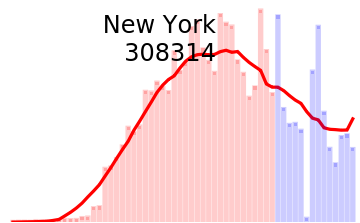
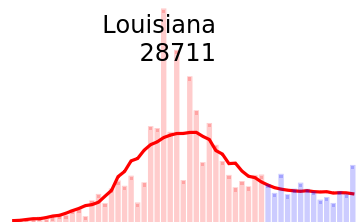
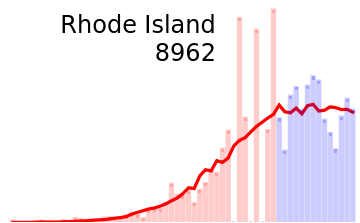
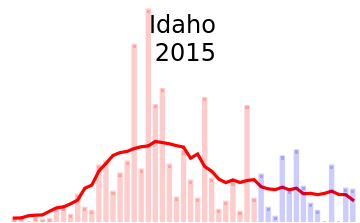
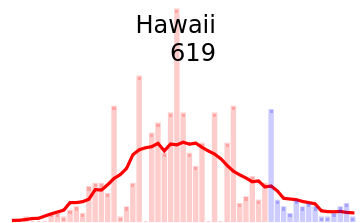
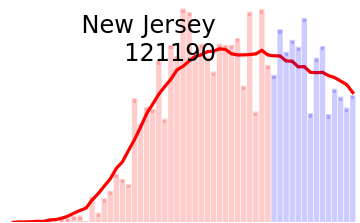
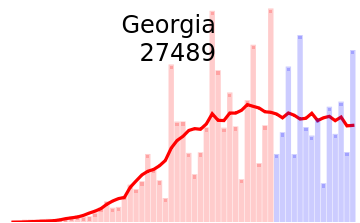
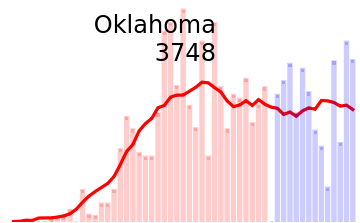
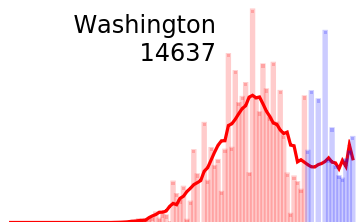
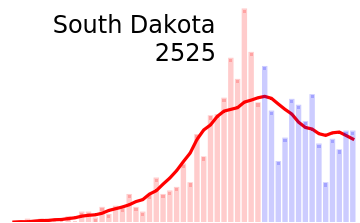
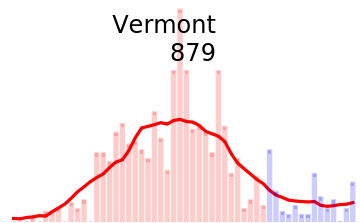
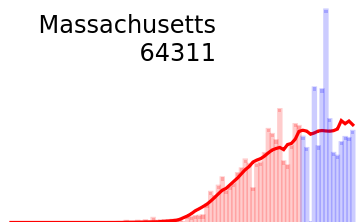
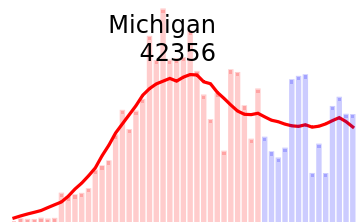
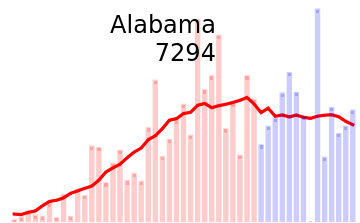
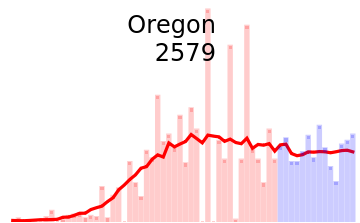
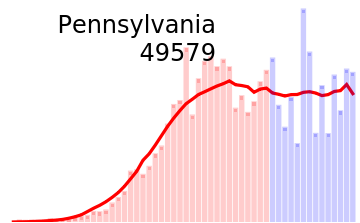
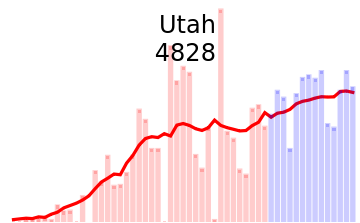
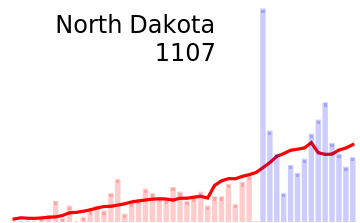
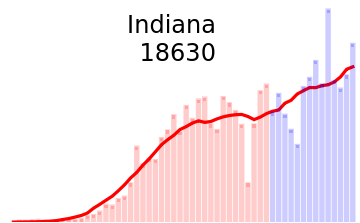
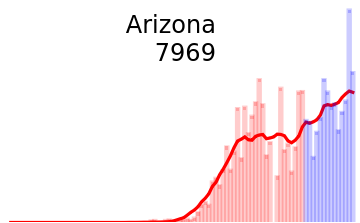
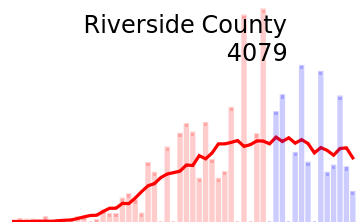
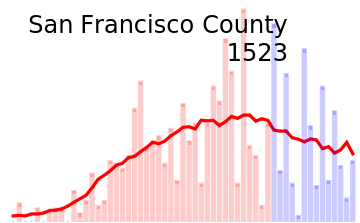
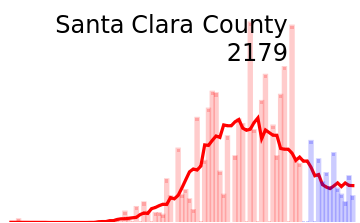
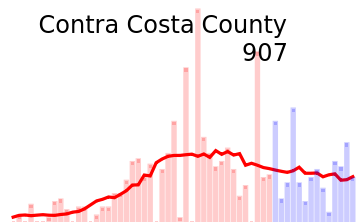
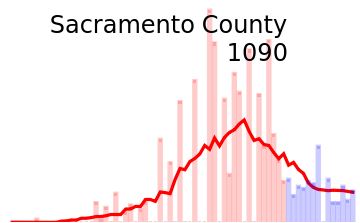
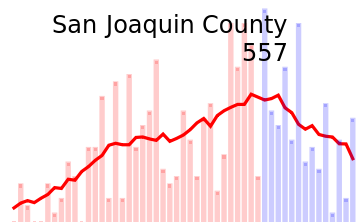
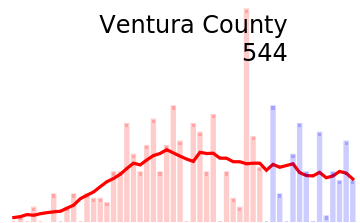
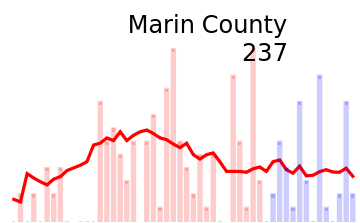
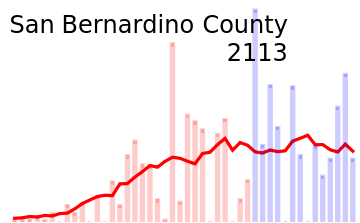
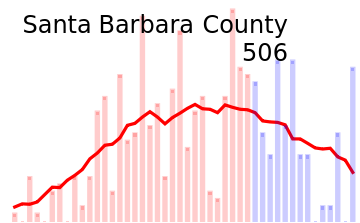
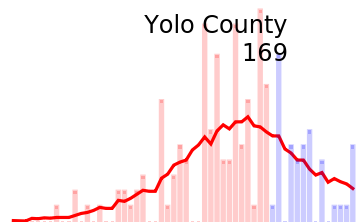
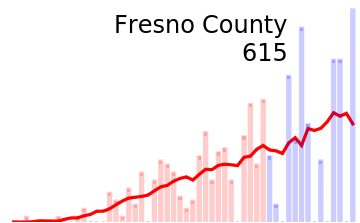
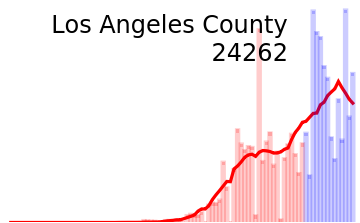
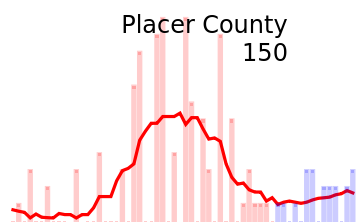
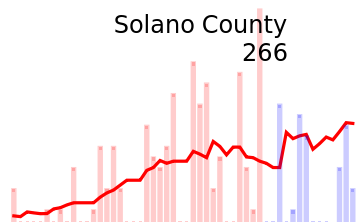
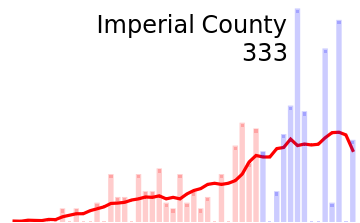
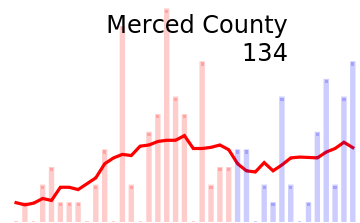
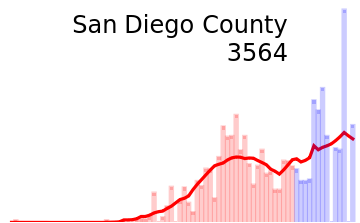
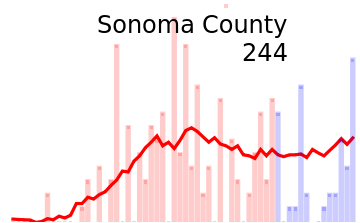
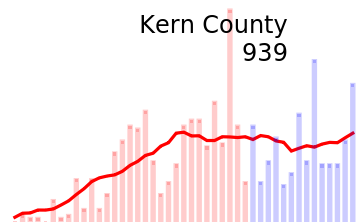
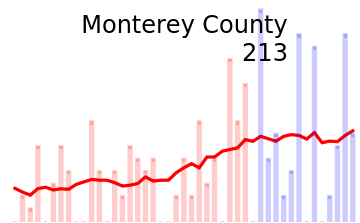
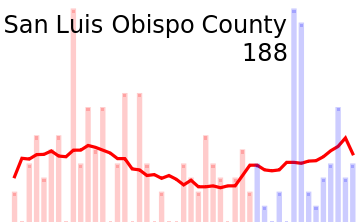
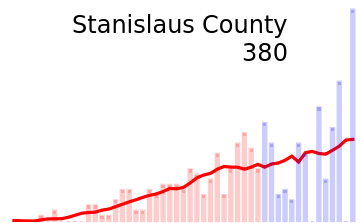
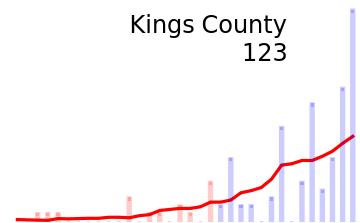
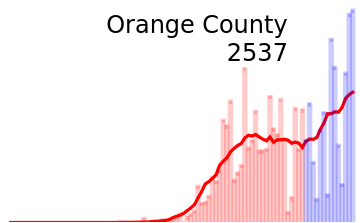
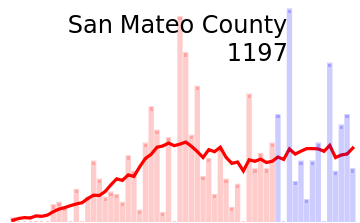
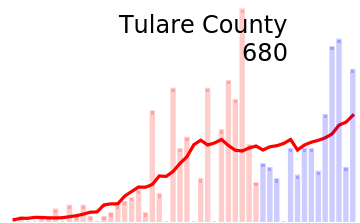
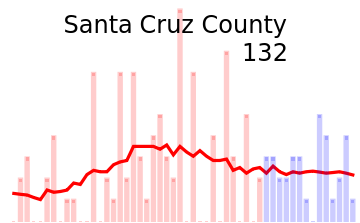
The Opening Up America Again guidelines recommend a criterion of “downward trajectory of documented cases within a 14-day period”, in order to proceeding to a phased opening. Motivated by some NYTimes visualizations, I’ve tried to categorize US states and California’s counties into three classes of “increase” in confirmed cases, “decrease”, or “more-or-less the same”. The classification measure is based on the range of 25%-75% quantiles for the growth rate of daily confirmed cases during the last two weeks. If these rates were mostly more than 1%, I tag the corresponding region as “increasing”, if mostly less than -1%, I tag them as “decreasing”, or if they are mostly between [-1,1], I tag the corresponding region as “more or less the same.” Note that I have used 7-days average values (solid red lines).
US states
US states
Out[]=
Confirmed cases of the last two weeks show a downward trajectory | |||||||||||||||||||||||||
| |||||||||||||||||||||||||
Confirmed cases of the last two weeks are more or less the same | |||||||||||||||||||||||||
| |||||||||||||||||||||||||
Confirmed cases of the last two weeks show an upward trajectory | |||||||||||||||||||||||||
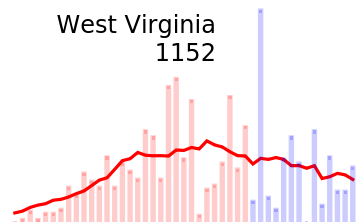
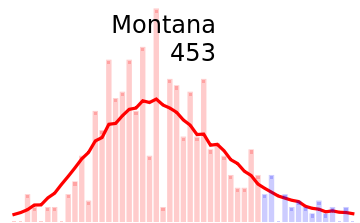
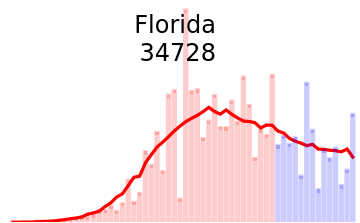
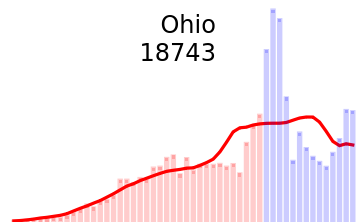
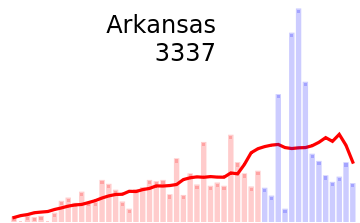
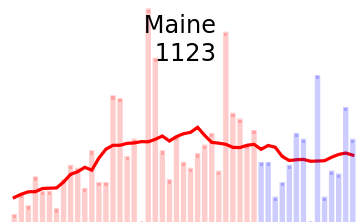
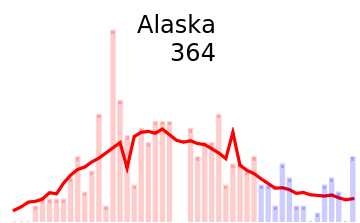
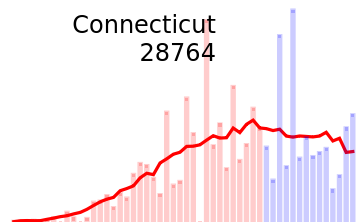
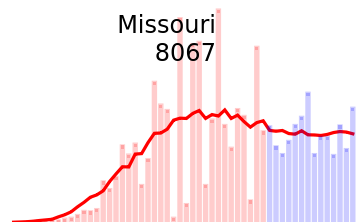
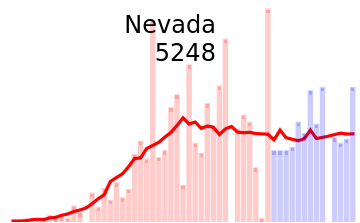
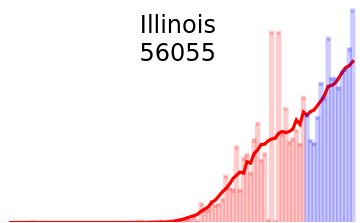
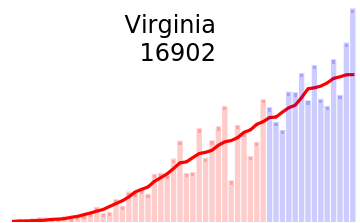
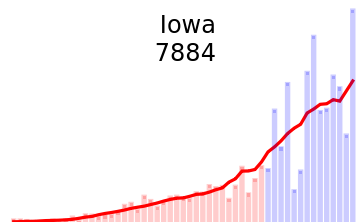
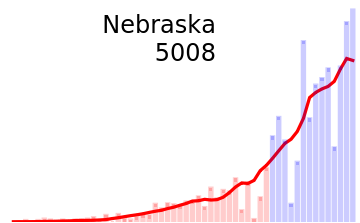
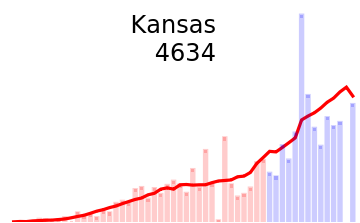
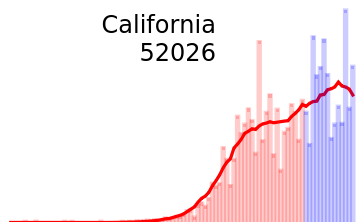
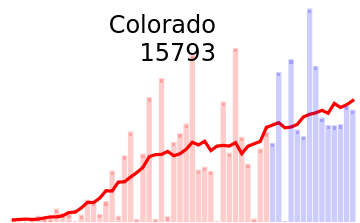
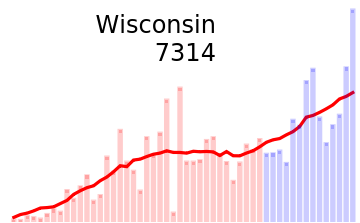
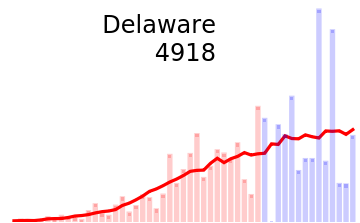
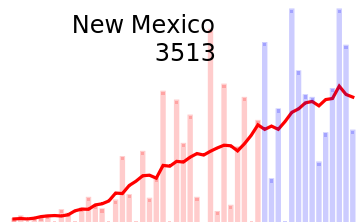
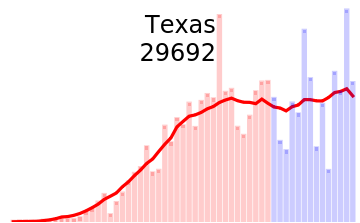
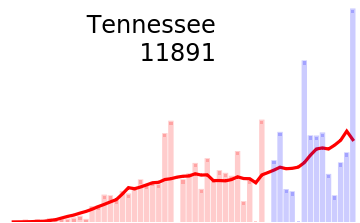
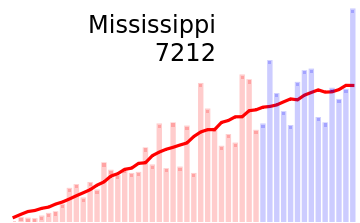
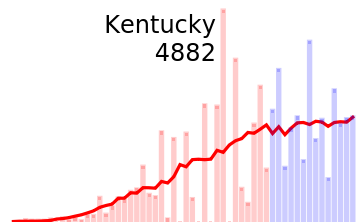
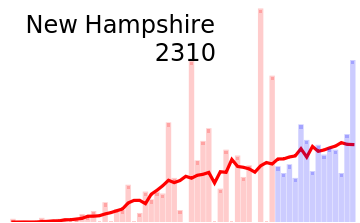
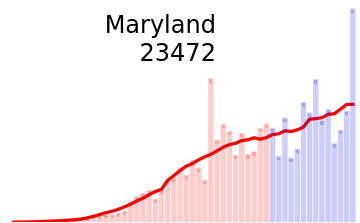
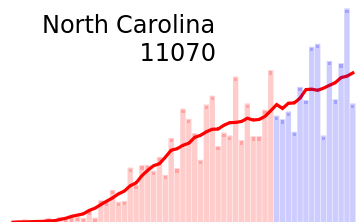
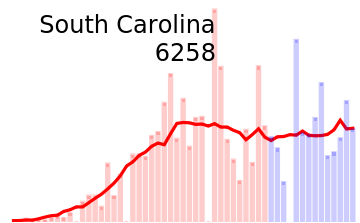
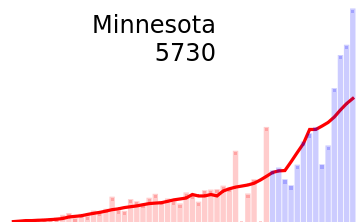
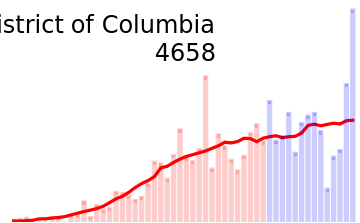
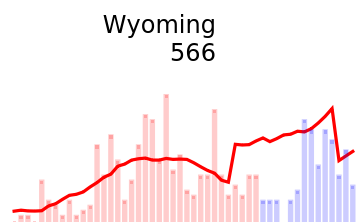
California counties
California counties
Out[]=
Confirmed cases of the last two weeks show a downward trajectory | ||||||||||||||||||||
| ||||||||||||||||||||
Confirmed cases of the last two weeks show an upward trajectory | ||||||||||||||||||||
| ||||||||||||||||||||
Confirmed cases of the last two weeks are more or less the same | ||||||||||||||||||||
|
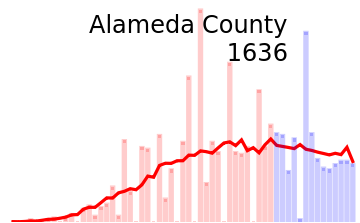
Initialization
Initialization
In[]:=
des=Style[#,Bold,18]&/@{"Confirmed cases of the last two weeks are more or less the same","Confirmed cases of the last two weeks show a downward trajectory","Confirmed cases of the last two weeks show an upward trajectory"};DeleteObject[ResourceObject["Epidemic Data for Novel Coronavirus COVID-19"]];