This live code notebook acquires the Vostok Paleoclimatology data from the NOAA cloud systems and performs rudimentary plotting and Wavelet filtering and smoothing. The purpose of this code is to allow non-programmers or novice-programmers to gain hands-on experience coding with actual scientific data. The Paleoclimatology data are derived from natural sources such as tree rings, ice cores, corals, stalagmites, and ocean and lake sediments. These proxy climate data extend the weather and climate information archive by hundreds to millions of years. The data include geophysical or biological measurement time series and some reconstructed climate variables such as temperature and precipitation. Scientists use paleoclimatology data and information to understand natural climate variability and future climate change.
In[]:=
DateObject[]
Out[]=

© 2012-Present CCN StudiosCreative Commons Attribution-NonCommercial-ShareAlike 4.0

Data Source
Data Source
See [1] for general acquisition of Paleoclimatology data where ice based or not.
I have selected a few samples with the corresponding published papers as a starter.
I have selected a few samples with the corresponding published papers as a starter.
In[]:=
url="https://www.ncei.noaa.gov/pub/data/paleo/icecore/antarctica/vostok/";Import[url]
Climate and atmospheric history of the past 420,000 years from the Vostok Ice Core
Climate and atmospheric history of the past 420,000 years from the Vostok Ice Core
Contribution Date
Date: 2001-11-01
Last Modified Date
Date: 2025-06-25
Authors: Petit, J.-R., J. Jouzel, D. Raynaud, N.I. Barkov, J.-M. Barnola, I. Basile, M. Bender, J. Chappellaz, M. Davis, G. Delaygue, M. Delmotte, V.M. Kotlyakov, M. Legrand, V. Lipenkov, C. Lorius, L. Pépin, C. Ritz, E. Saltzman, and M. Stievenard
Published Date or Year: 1999-06-03
Published Title: Climate and atmospheric history of the past 420,000 years from the Vostok Ice Core
DOI: https://doi.org/10.1038/20859
Abstract: The recent completion of drilling at Vostok station in East Antarctica has allowed the extension of the ice record of atmospheric composition and climate to the past four glacial interglacial cycles. The succession of changes through each climate cycle and termination was similar, and atmospheric and climate properties oscillated between stable bounds. Interglacial periods differed in temporal evolution and duration. Atmospheric concentrations of carbon dioxide and methane correlate well with Antarctic air-temperature throughout the record. Present-day atmospheric burdens of these two important greenhouse gases seem to have been unprecedented during the past 420,000 years.
gas_ageBP gas age, calendar year before presentCO2 carbon dioxide, parts per million
url="https://www.ncei.noaa.gov/pub/data/paleo/icecore/antarctica/vostok/co2nat-noaa.txt";datavos0=Import[url,"Table"];
In[]:=
datavos0[[263]]
Out[]=
{gas_ageBP,CO2}
In[]:=
data=ToExpression@Drop[datavos0,263];data[[1]]
Out[]=
{2342,284.7}
In[]:=
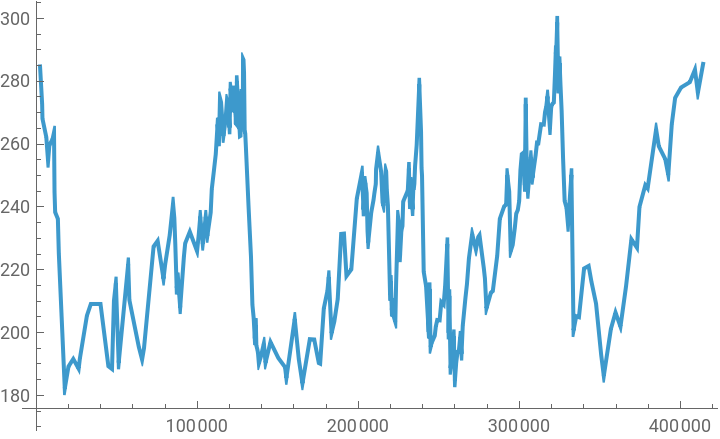
ListLinePlot[data[[All,{1,2}]]]
Out[]=
In[]:=
dwd=StationaryWaveletTransform[data[[All,2]],DaubechiesWavelet[2],3]
Out[]=
DiscreteWaveletData


In[]:=
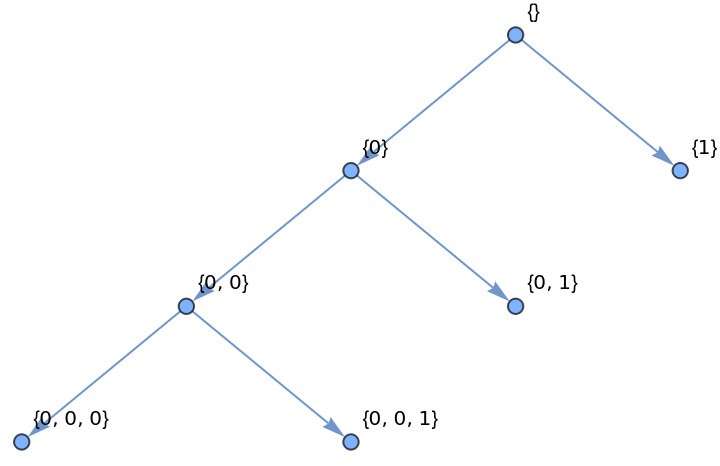
dwd["TreeView"]
Out[]=
In[]:=
dwd["EnergyFraction"]
Out[]=
{{1}0.000385183,{0,1}0.000451554,{0,0,1}0.000821642,{0,0,0}0.998342}
In[]:=
Reverse@SortBy[dwd["EnergyFraction"],Last]
Out[]=
{{0,0,0}0.998342,{0,0,1}0.000821642,{0,1}0.000451554,{1}0.000385183}
In[]:=
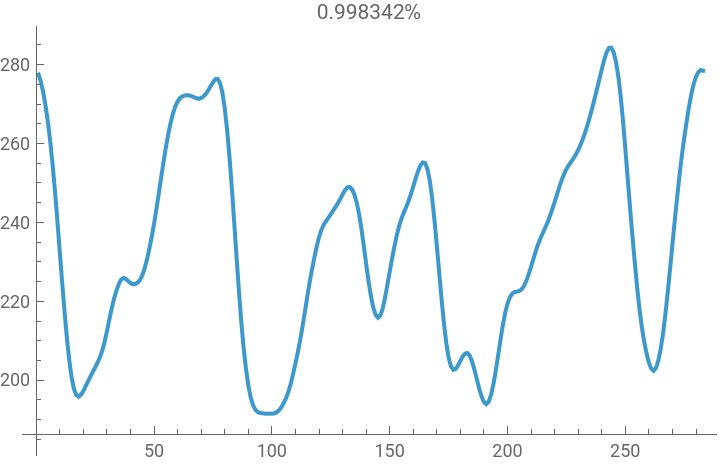
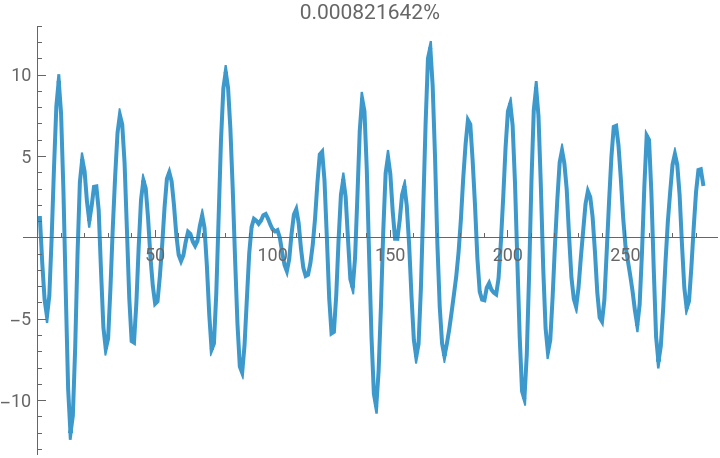
Map[#[[1]]->ListLinePlot[InverseWaveletTransform[dwd,Automatic,#[[1]]],PlotLabel->Row@{#[[2]],"%"}]&,Reverse@SortBy[dwd["EnergyFraction"],Last]]
Out[]=
{0,0,0}
,{0,0,1}
,{0,1}
,{1}
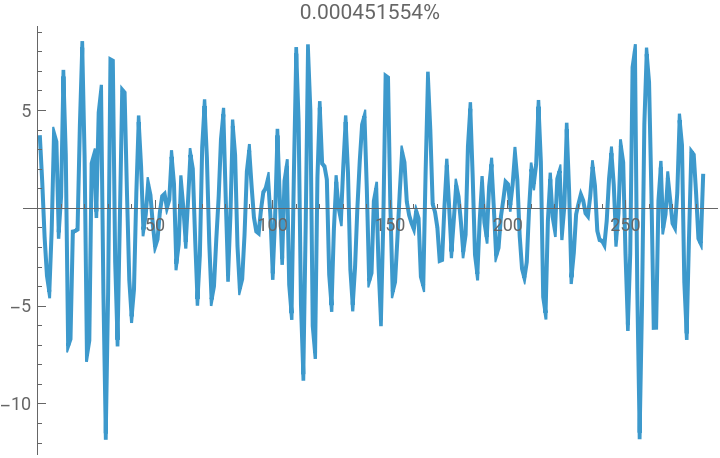
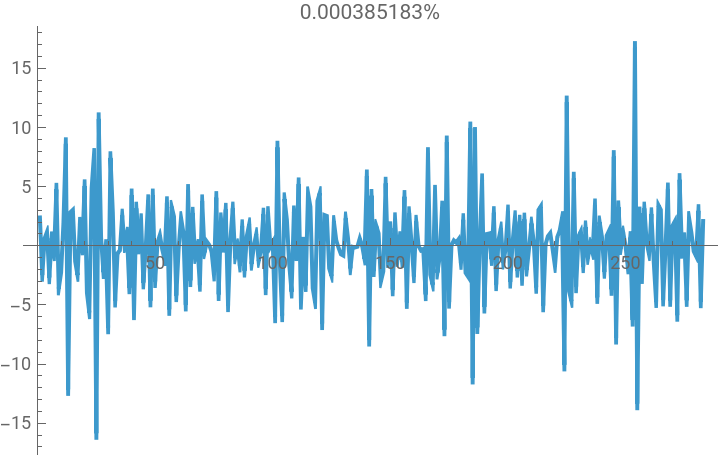
In[]:=
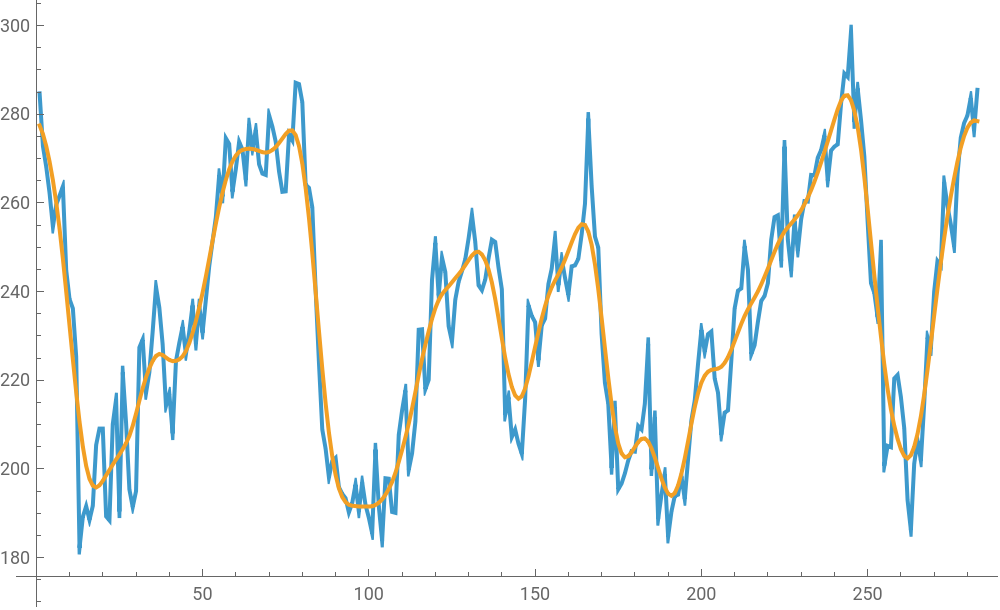
ListLinePlot[{data[[All,2]],InverseWaveletTransform[dwd,Automatic,{0,0,0}]},ImageSize->500]
Out[]=
In[]:=
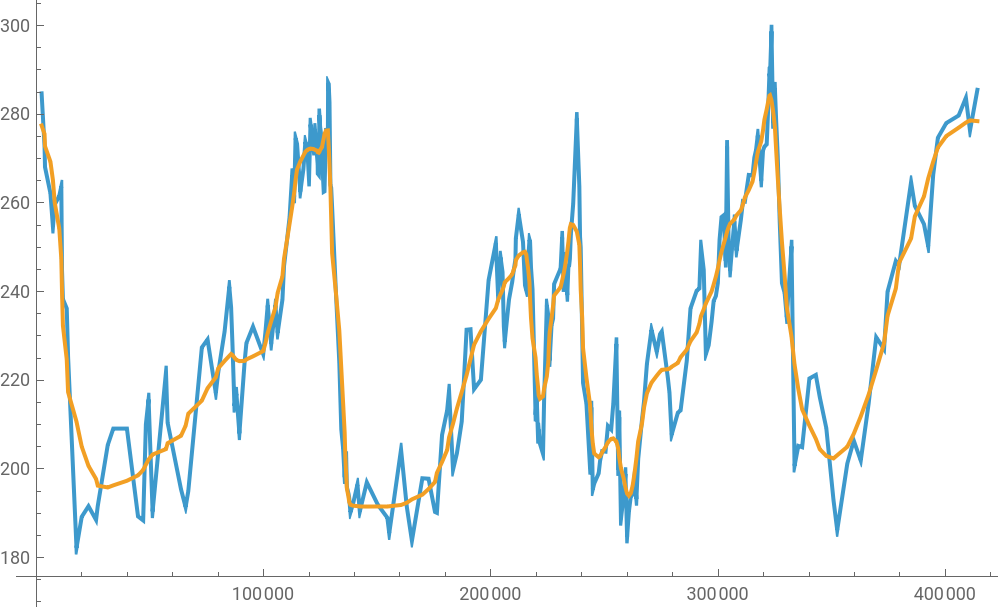
ListLinePlot[{Thread[{data[[All,1]],data[[All,2]]}],Thread[{data[[All,1]],InverseWaveletTransform[dwd,Automatic,{0,0,0}]}]},ImageSize->500,PlotLegends->{"Original","Trend"}]
Out[]=


Vostok : Carbon Dioxide Data for Last 160,000 Years
Vostok : Carbon Dioxide Data for Last 160,000 Years
Contribution_Date
Date: 1997-12-08
Last Modified Date
Date: 2025-06-25
Investigators: Barnola, J.-M.; Raynaud, D.; Korotkevich, Y.S.; Lorius, C.
Publication Title: Vostok ice core provides 160,000-year record of atmospheric CO2
Publication Year: 01 October 1987
DOI: http://doi.org/10.1038/329408a0
Date: 1997-12-08
Last Modified Date
Date: 2025-06-25
Investigators: Barnola, J.-M.; Raynaud, D.; Korotkevich, Y.S.; Lorius, C.
Publication Title: Vostok ice core provides 160,000-year record of atmospheric CO2
Publication Year: 01 October 1987
DOI: http://doi.org/10.1038/329408a0
Abstract: Direct evidence of past atmospheric CO2 changes has been extended to the past 160,000 years from the Vostok ice core. These changes are most notably an inherent phenomenon of change between glacial and interglacial periods. Besides this major 100,000-year cycle, the CO2 record seems to exhibit a cyclic change with a period of some 21,000 years.
depth_m depth meterice_ageBP ice age, calendar year before presentgas_ageBP gas age calendar year before present CO2_mean carbon dioxide forcing,averaged,mechanical dry extraction;gas chromatographyCO2_max carbon dioxide maxCO2_min carbon dioxide min
Trend: {0, 0, 0}
Trend: {0, 0, 0}
InverseWaveletTransform[dwd,Automatic,{0,0,0}] reconstructs that portion of the data known as the Trend:
Composition: {0, 0, 0} + {0, 0, 1} + {0, 1}
Composition: {0, 0, 0} + {0, 0, 1} + {0, 1}
We can add more components of the decomposition, simply add, to get a better approximation to the data:
Vostok: Antarctica 350 Year Ice Core Deuterium Data and Temperature
Vostok: Antarctica 350 Year Ice Core Deuterium Data and Temperature
Contribution Date
Date: 2017-05-19
Last Modified Date
Date: 2024-08-17
Description: Ice core deuterium (dD) data and temperature reconstruction from snow pits and shallow cores at Vostok, Antarctica. PAGES2k notes: Temp inferred from accumulation rate; defer to isotopes
Publication Authors: Ekaykin, A.A.; Kozachek, A.V.; Lipenkov, V.Ya.; Shibaev, Yu.A.
Journal Name: Annals of Glaciology
Published Title: Multiple climate shifts in the Southern Hemisphere over the past three centuries based on central Antarctic snow pits and core studies
DOI: https://doi.org/10.3189/2014AoG66A189
Abstract: Based on the results of geochemical and glaciological investigations in snow pits and shallow cores, regional stack series of air temperature in central Antarctica (in the southern part of Vostok Subglacial Lake) were obtained, covering the last 350 years. It is shown that this parameter varied quasi-periodically with a wavelength of 30-50 years. The correlation of the newly obtained record with the circulation indices of the Southern Hemisphere (SH) shows that the central Antarctic climate is mainly governed by the type of circulation in the SH: under conditions of zonal circulation, negative anomalies of temperature and precipitation rate are observed, whereas the sign of the anomalies is positive during meridional circulation. In the 1970s the sign of the relationship between many climatic parameters changed, which is likely related to the rearrangement of the climatic system of the SH. The data suggest that during the past 350 years such events have taken place at least five times. The stable water isotope content of the central Antarctic snow is governed by the summer temperature rather than the mean annual temperature, which is interpreted as the influence of ‘post-depositional’ effects.
Composition: {0, 0, 0} + {0, 0, 1}
Composition: {0, 0, 0} + {0, 0, 1}
We can add more components of the decomposition, simply add, to get a better approximation to the data:
Composition: {0, 0, 0} + {0, 0, 1}
Composition: {0, 0, 0} + {0, 0, 1}
We can add more components of the decomposition, simply add, to get a better approximation to the data:
References
References
[1] NCEI offers search and download of Paleoclimatic proxy data and Paleoclimate Reconstructions from the NOAA/World Data Service for Paleoclimatology archives. Over 10,000 data sets are available, derived from natural sources such as tree rings, ice cores, corals, and ocean and lake sediments. Use the General search box or Advanced search to improve filtering by investigators, locations, keywords and time periods.
https://www.ncei.noaa.gov/access/paleo-search/
https://www.ncei.noaa.gov/access/paleo-search/
CITE THIS NOTEBOOK
CITE THIS NOTEBOOK
Vostok ice core: isotope, gas & temperature reconstruction — NOAA NCEI (fully coded)
by Dara Shayda
Wolfram Community, STAFF PICKS, March 25, 2026
https://community.wolfram.com/groups/-/m/t/3669201
by Dara Shayda
Wolfram Community, STAFF PICKS, March 25, 2026
https://community.wolfram.com/groups/-/m/t/3669201