Vapor-Liquid Data for Acetic Acid-Water Mixture: Effect of Gas Phase Dimerization
Vapor-Liquid Data for Acetic Acid-Water Mixture: Effect of Gas Phase Dimerization


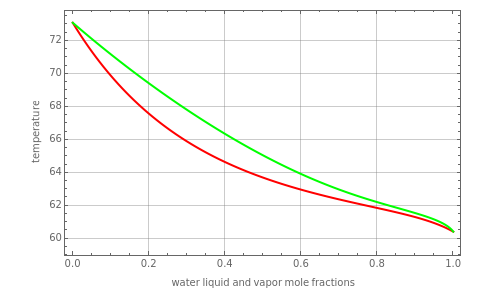
This Demonstration plots the vapor-liquid isobaric diagram and equilibrium curve at low to moderate pressures for a binary mixture of acetic acid and water.
Deviation from ideal behavior in the liquid phase is considered using the Wilson model. Gas-phase dimerization of acetic acid is also taken into account. The dimerization equilibrium constant was taken from G. Venimadhavan, M. Malone, and M. Doherty, "Bifurcation Study of Kinetic Effects in Reactive Distillation," AIChE Journal, 45(3), 1999 pp. 546–556:
K
d
-12.5454+
3166
T
10
T
The bubble-point and dew-point curves are represented in red and green, respectively. The equilibrium curve is show in blue.
Permanent Citation
Permanent Citation