Data on Covid19 infections in Argentina
Data on Covid19 infections in Argentina
In[]:=
(*UpdatedApril3,2020*)casosarg={{5,1},{6,2},{7,9},{8,12},{9,17},{10,19},{11,21},{12,31},{13,34},{14,45},{15,56},{16,65},{17,79},{18,97},{19,129},{20,158},{21,225},{22,266},{23,301},{24,387},{25,502},{26,589},{27,690},{28,745},{29,820},{30,966},{31,1054},{32,1133},{33,1265},{34,1353},{35,1451}};(*Consideringadataerrorofabout5percent*)errorescasoarg=Table[casosarg[[i,2]]*0.05,{i,1,Length[casosarg]}];corona=ListPlot[casosarg,PlotStyleRed]
Out[]=
In[]:=
datamatrix=Import["https://github.com/tobiascanavesi/covidarg/blob/master/datoscovid.txt?raw=true","Table",CharacterEncoding"UTF8"]//MatrixForm;
In[]:=
Analysis of different methods of the predict function
Analysis of different methods of the predict function
In[]:=
(*Comparisonsofpredictivefunctionsusing26cases*)
In[]:=
casosargtraining=Table[i+4->casosarg[[i,2]],{i,Length[casosarg[[1;;26]]]}];
In[]:=
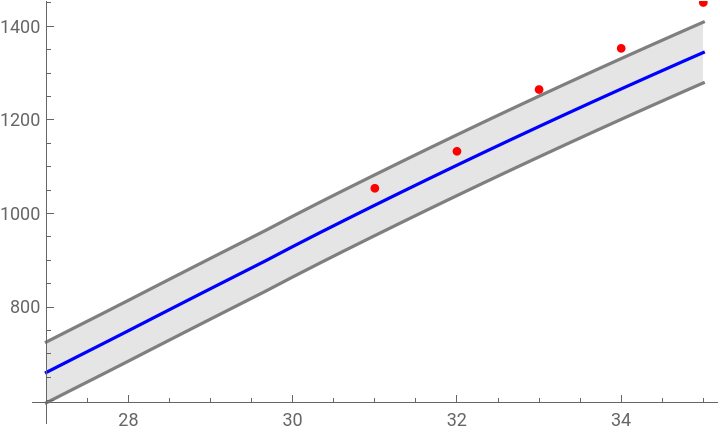
p0=Predict[casosargtraining,Method"NeuralNetwork"]
Out[]=
PredictorFunction


In[]:=
Show[Plot[{p0[x],p0[x]+StandardDeviation[p0[x,"Distribution"]],p0[x]-StandardDeviation[p0[x,"Distribution"]]},{x,27,35},PlotStyle{Blue,Gray,Gray},Filling{2{3}},ExclusionsFalse,PerformanceGoal"Speed",PlotLegends{"Prediction Neural Network","Confidence Interval"}],ListPlot[List@@@casosarg[[27;;31]],PlotStyleRed,PlotLegends{"Data"}]]
Out[]=


In[]:=
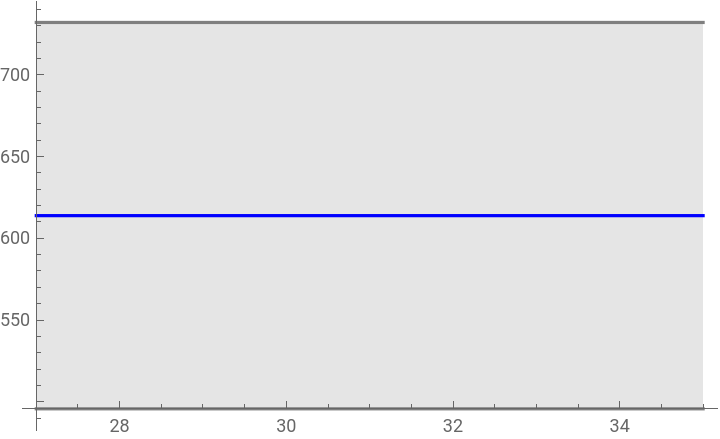
p1=Predict[casosargtraining,Method->"GradientBoostedTrees"]
Out[]=
PredictorFunction
In[]:=
Show[Plot[{p1[x],p1[x]+StandardDeviation[p1[x,"Distribution"]],p1[x]-StandardDeviation[p1[x,"Distribution"]]},{x,27,35},PlotStyle{Blue,Gray,Gray},Filling{2{3}},ExclusionsFalse,PerformanceGoal"Speed",PlotLegends{"Prediction Gradient Boosted Trees","Confidence Interval"}],ListPlot[List@@@casosarg[[27;;31]],PlotStyleRed,PlotLegends{"Data"}]]
Out[]=
In[]:=
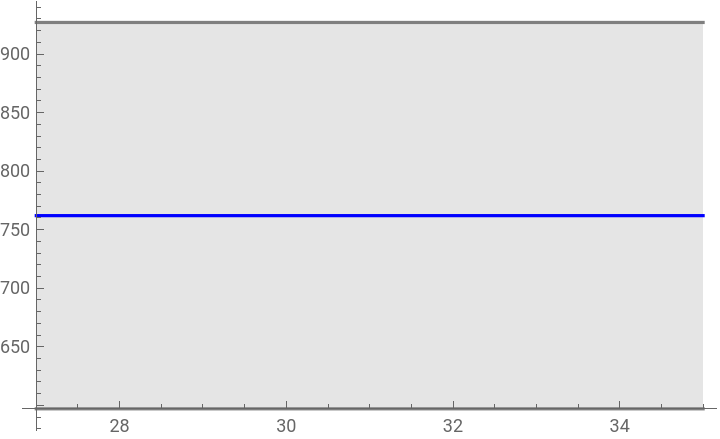
p2=Predict[casosargtraining,Method->"DecisionTree"]
Out[]=
PredictorFunction
In[]:=
Show[Plot[{p2[x],p2[x]+StandardDeviation[p2[x,"Distribution"]],p2[x]-StandardDeviation[p2[x,"Distribution"]]},{x,27,35},PlotStyle{Blue,Gray,Gray},Filling{2{3}},ExclusionsFalse,PerformanceGoal"Speed",PlotLegends{"Prediction Decision Tree","Confidence Interval"}],ListPlot[List@@@casosarg[[27;;31]],PlotStyleRed,PlotLegends{"Data"}]]
Out[]=
In[]:=
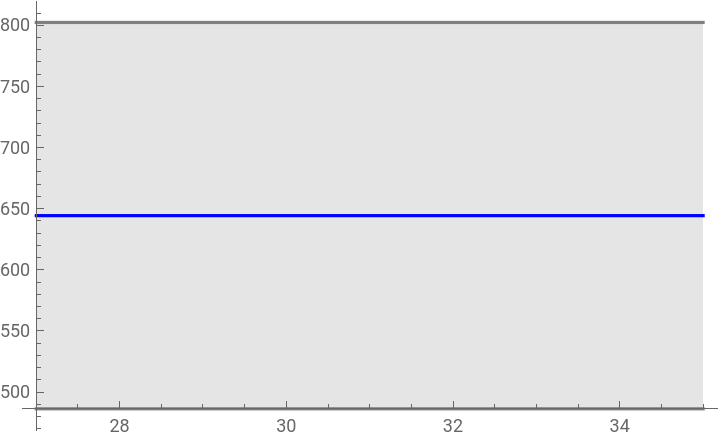
p3=Predict[casosargtraining,Method->"RandomForest"]
Out[]=
PredictorFunction
In[]:=
Show[Plot[{p3[x],p3[x]+StandardDeviation[p3[x,"Distribution"]],p3[x]-StandardDeviation[p3[x,"Distribution"]]},{x,27,35},PlotStyle{Blue,Gray,Gray},Filling{2{3}},ExclusionsFalse,PerformanceGoal"Speed",PlotLegends{"Prediction Random Forest","Confidence Interval"}],ListPlot[List@@@casosarg[[27;;31]],PlotStyleRed,PlotLegends{"Data"}]]
Out[]=
In[]:=
p4=Predict[casosargtraining,Method->"GaussianProcess"]
Out[]=
PredictorFunction
In[]:=
Show[Plot[{p4[x],p4[x]+StandardDeviation[p4[x,"Distribution"]],p4[x]-StandardDeviation[p4[x,"Distribution"]]},{x,27,35},PlotStyle{Blue,Gray,Gray},Filling{2{3}},ExclusionsFalse,PerformanceGoal"Speed",PlotLegends{"Prediction Gaussian Process","Confidence Interval"}],ListPlot[List@@@casosarg[[27;;31]],PlotStyleRed,PlotLegends{"Data"}]]
Out[]=
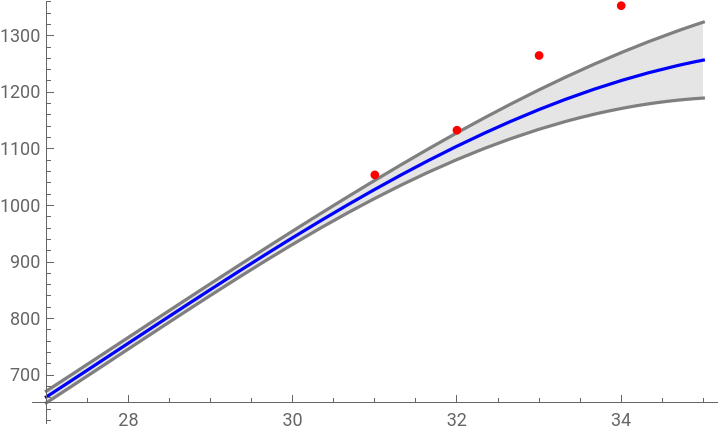
In[]:=
(*HereHerewecanseehoweachpredictordiddaybyday,thecloserto1thebetterthepredictorworked*)
In[]:=
differentpredicts=Table[{(Abs[p0[1+i]])/(casosarg[[i,2]]),(Abs[p1[1+i]])/(casosarg[[i,2]]),(Abs[p2[1+i]])/(casosarg[[i,2]]),(Abs[p3[1+i]])/(casosarg[[i,2]]),(Abs[p4[1+i]])/(casosarg[[i,2]])},{i,27,Length[casosarg]}]
Out[]=
{{0.711277,0.582385,0.72296,0.611265,0.71797},{0.740969,0.541778,0.672551,0.568644,0.751586},{0.734708,0.485244,0.602372,0.509307,0.745541},{0.752295,0.453684,0.563193,0.476181,0.760129},{0.760366,0.423042,0.525155,0.44402,0.76138}}
In[]:=
neuralplot=Show[ListPlot[Table[differentpredicts[[i,1]],{i,1,Length[differentpredicts]}]],Plot[Evaluate[y=1],{x,0,5},PlotStyleRed],PlotLabel"Neural Network",PlotRange->All]
Figures on the progress of the Covid19 in Argentina
Figures on the progress of the Covid19 in Argentina
DATA
DATA