Batch Reactor Using the Segregation Model
Batch Reactor Using the Segregation Model


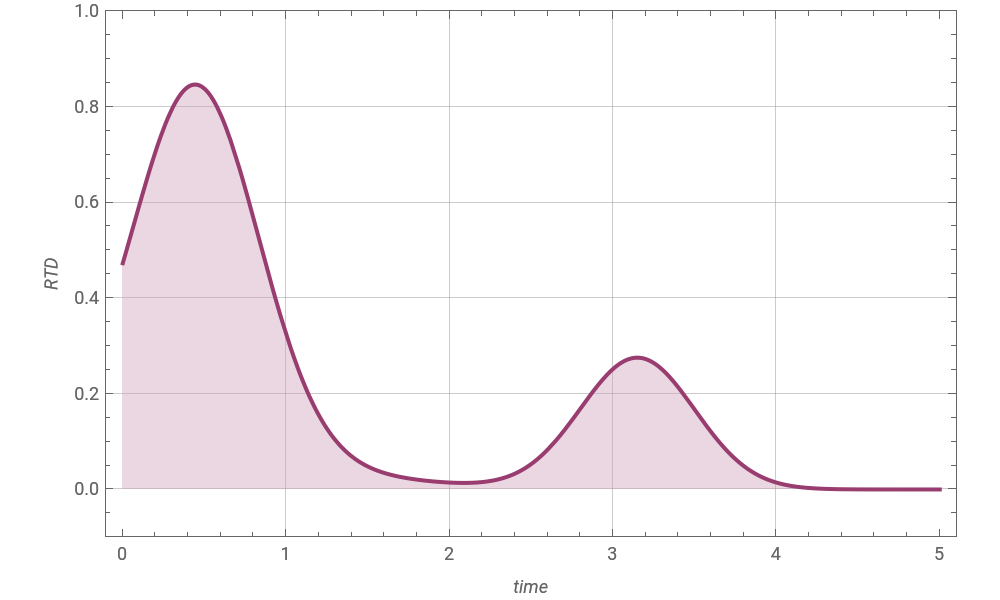
Consider a mixture distribution formed by taking a weighted sum of three normal distributions and given by
f(x)=++
1
5
2π
-/2
2
x
e
1
σ
1
-2
2
(x-)
μ
1
2
σ
1
e
3
σ
2
-2
2
(x-)
μ
2
2
σ
2
e
You can change this distribution's properties by varying , , , and . This Demonstration plots this distribution. For specific values of , , , and , you can obtain a bimodal distribution, which mimics the residence time distribution (or ) of a batch reactor.
μ
1
μ
2
σ
1
σ
2
μ
1
μ
2
σ
1
σ
2
RTD
The following sequential reaction mechanism takes place in this reactor:
A+B→C
A→D
B+D→E
All rate constants are set equal to one. Initially, the reactor contains only species and .
A
B
The segregation model and the function allow the calculation of the exit concentration as a function of time for all species. This Demonstration gives the exit concentration in light blue, magenta, brown, green, and dark blue for species , , , , and , respectively. The first two snapshots show: (1) a bimodal and (2) the batch reactor's exit concentrations versus time, which present two plateaus as expected.
RTD
A
B
C
D
E
RTD
Details
Details
All governing equations and corresponding parameter values are from[1].
References
References
[1] H. S. Fogler, Elements of Chemical Reaction Engineering, 3rd ed., Upper Saddle River, NJ: Prentice Hall, 1999.
External Links
External Links
Permanent Citation
Permanent Citation
Housam Binous, Ahmed Bellagi
"Batch Reactor Using the Segregation Model"
http://demonstrations.wolfram.com/BatchReactorUsingTheSegregationModel/
Wolfram Demonstrations Project
Published: May 6, 2011