Overview
Overview
This notebook updates the previous evaluation of the Schwab API with option price data. The returned data structure is explored to enable easier extraction of the data. I have learned from the developers that Schwab uses the Bjerksund-Stensland option formula so it should be compatible with the FinancialDerivative[] American calls and puts. This analysis below shows this to be true.
This notebook can be rerun to get realtime calculations. The SchabAPI package with Mathematica is a powerful options exploration tool.
This notebook can be rerun to get realtime calculations. The SchabAPI package with Mathematica is a powerful options exploration tool.
Option chain structure
Option chain structure
In[]:=
Needs["SchwabAPI`"];apiTokens=Import[tokenFile,"RawJSON"];automaticTokenRefresh[appKey,appSecret,apiTokens["refresh_token"]]
Out[]=
Running
In[]:=
ticker="LLY";
In[]:=
startTime=Now[];options=SchwabGetOptionChain[ticker,apiTokens["access_token"],"strikeCount"50];If[options===$Failed,Abort[]]
options contains essentially all the options chain for the ticker symbol. The request can be filtered by Option requests to make smaller. Some examples of how to do that are shown at the end of my first Wolfram Community post on the API.
In[]:=
ByteCount[options]
Out[]=
16757040
The data is Import[]ed as RawJSON and it is important to understand the structure which consists of keys with values that are Associations at the end of the key structure. There are two sets of data here that we need here to get prices and option parameters, the put and call maps, which have the same upper level structures
In[]:=
Keys@options
Out[]=
{symbol,status,underlying,strategy,interval,isDelayed,isIndex,interestRate,underlyingPrice,volatility,daysToExpiration,dividendYield,numberOfContracts,assetMainType,assetSubType,isChainTruncated,callExpDateMap,putExpDateMap}
These keys are the option expiration dates, but the number after the colon may differ after each run of SchwabGetOptionChain[].
In[]:=
expirationKeyList=Keys@options["callExpDateMap"]
Out[]=
{2025-05-09:2,2025-05-16:9,2025-05-23:16,2025-05-30:23,2025-06-06:30,2025-06-13:37,2025-06-20:44,2025-07-18:72,2025-08-15:100,2025-09-19:135,2025-10-17:163,2025-12-19:226,2026-01-16:254,2026-03-20:317,2026-06-18:407,2026-12-18:590,2027-01-15:618,2027-06-17:771}
For this notebook I will choose the the January expiration so the notebook will be valid for a while. The keys to this level are option strike prices as strings. Let’s choose “780.0” to further examine the structure.
In[]:=
janCallKey=Select[expirationKeyList,StringContainsQ[#,"2026-01-16"]&][[1]]
Out[]=
2026-01-16:254
In[]:=
Keys@options["callExpDateMap"][janCallKey]
Out[]=
{530.0,540.0,550.0,560.0,570.0,580.0,590.0,600.0,610.0,620.0,630.0,640.0,650.0,660.0,670.0,680.0,690.0,700.0,710.0,720.0,730.0,740.0,750.0,760.0,770.0,780.0,790.0,800.0,820.0,840.0,860.0,880.0,900.0,920.0,940.0,960.0,980.0,1000.0,1020.0,1040.0,1060.0,1080.0,1100.0,1120.0,1140.0,1160.0,1180.0,1200.0,1220.0,1240.0}
This gives a the keys to the data that we want, but note that the keys are a list within a list so to access the keys directly we have to extract from the outer list.
In[]:=
Keys@options["callExpDateMap"][janCallKey]["780.0"]
Out[]=
{{putCall,symbol,description,exchangeName,bid,ask,last,mark,bidSize,askSize,bidAskSize,lastSize,highPrice,lowPrice,openPrice,closePrice,totalVolume,tradeTimeInLong,quoteTimeInLong,netChange,volatility,delta,gamma,theta,vega,rho,openInterest,timeValue,theoreticalOptionValue,theoreticalVolatility,optionDeliverablesList,strikePrice,expirationDate,daysToExpiration,expirationType,lastTradingDay,multiplier,settlementType,deliverableNote,percentChange,markChange,markPercentChange,intrinsicValue,extrinsicValue,optionRoot,exerciseType,high52Week,low52Week,nonStandard,pennyPilot,inTheMoney,mini}}
This gives the structure we want to get the data. Note that the list only applies to the January expiration for the “7.80.” call. The parameters include everything needed to explore options, including calculation of the “greeks”.
In[]:=
Keys@options["callExpDateMap"][janCallKey]["780.0"][[1]]
Out[]=
{putCall,symbol,description,exchangeName,bid,ask,last,mark,bidSize,askSize,bidAskSize,lastSize,highPrice,lowPrice,openPrice,closePrice,totalVolume,tradeTimeInLong,quoteTimeInLong,netChange,volatility,delta,gamma,theta,vega,rho,openInterest,timeValue,theoreticalOptionValue,theoreticalVolatility,optionDeliverablesList,strikePrice,expirationDate,daysToExpiration,expirationType,lastTradingDay,multiplier,settlementType,deliverableNote,percentChange,markChange,markPercentChange,intrinsicValue,extrinsicValue,optionRoot,exerciseType,high52Week,low52Week,nonStandard,pennyPilot,inTheMoney,mini}
This is the structure to get the strikePrice. Now we can make functions to get the data we want.
In[]:=
options["callExpDateMap"][janCallKey]["780.0"][[1]]["strikePrice"]
Out[]=
780.
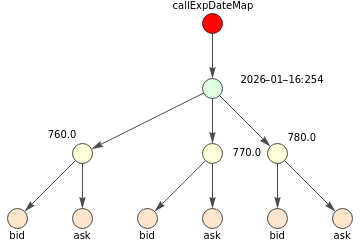
Grok made this graph to demonstrate the structure using the cells above for only the bid and ask. We first tried the whole structure, then trimmed the number of notes to make it understandable. The code for the graph is an attachment. I did not write a line of it; I didn’t even read it. From now on Grok will make all my graphs.
Out[]=
Get call data
Get call data
In[]:=
expirationKeyList=Keys@options["callExpDateMap"];janCallKey=Select[expirationKeyList,StringContainsQ[#,"2026-01-16"]&][[1]]strikeKeys=Keys@options["callExpDateMap"][janCallKey];strikePrices=options["callExpDateMap"][janCallKey][#][[1]]["strikePrice"]&/@strikeKeys
Out[]=
2026-01-16:254
Out[]=
{530.,540.,550.,560.,570.,580.,590.,600.,610.,620.,630.,640.,650.,660.,670.,680.,690.,700.,710.,720.,730.,740.,750.,760.,770.,780.,790.,800.,820.,840.,860.,880.,900.,920.,940.,960.,980.,1000.,1020.,1040.,1060.,1080.,1100.,1120.,1140.,1160.,1180.,1200.,1220.,1240.}
In[]:=
bidPrices=options["callExpDateMap"][janCallKey][#][[1]]["bid"]&/@strikeKeys;
In[]:=
impliedVol=options["callExpDateMap"][janCallKey][#][[1]]["volatility"]&/@strikeKeys;
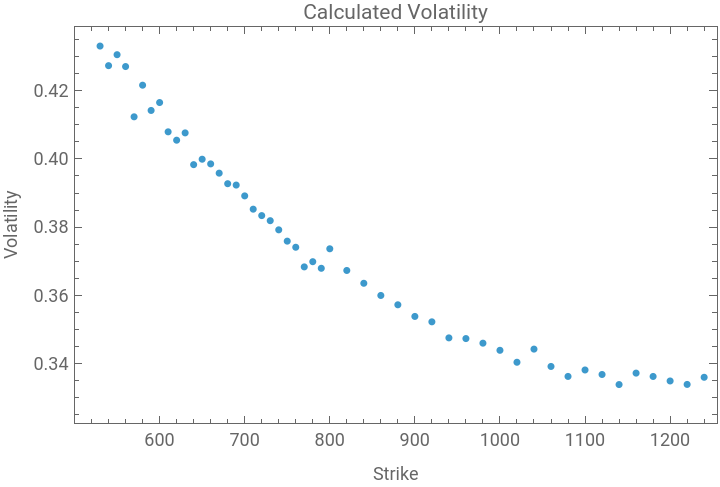
Note that volatilities are calculated for each strike price and are 100 times the value that will be used in the option calculations.
In[]:=
ListPlot[Transpose[{strikePrices,impliedVol/100}],Frame->True,FrameLabel->{"Strike","Volatility"},PlotLabel->"Calculated Volatility"]
Out[]=
In[]:=
expDays=options["callExpDateMap"][janCallKey][#][[1]]["daysToExpiration"]&/@strikeKeys//Union//First
Out[]=
254
We need some other information that can be extracted at the top level.
In[]:=
options["underlying"]
Out[]=
symbolLLY,descriptionELI LILLY AND CO,change-0.53,percentChange-0.07,close775.12,quoteTime1746644002290,tradeTime1746644002756,bid774.24,ask774.93,last774.59,mark774.59,markChange-0.53,markPercentChange-0.07,bidSize2,askSize1,highPrice784.34,lowPrice772.26,openPrice780.5,totalVolume2076388,exchangeNameNYSE,fiftyTwoWeekHigh972.53,fiftyTwoWeekLow677.09,delayedFalse
In[]:=
FromUnixTime[options["underlying"]["tradeTime"]/1000]curprice=options["underlying"]["last"]
Out[]=
Out[]=
774.59
In[]:=
div=options["dividendYield"](*thismayneedtobedividedby100ifarealyiedisreturned*)div=If[div==-1.,4QuantityMagnitude[FinancialData[ticker,"Dividend"]]/curprice,div]
Out[]=
-1.
Out[]=
0.00774603
In[]:=
intrate=options["interestRate"]/100
Out[]=
0.0425
Get put data
Get put data
In[]:=
expirationKeyList=Keys@options["putExpDateMap"];janPutKey=Select[expirationKeyList,StringContainsQ[#,"2026-01-16"]&][[1]]
Out[]=
2026-01-16:254
In[]:=
pstrikeKeys=Keys@options["putExpDateMap"][janPutKey];pstrikePrices=options["callExpDateMap"][janPutKey][#][[1]]["strikePrice"]&/@strikeKeys;
In[]:=
pstrikeKeys==strikeKeyspstrikePrices==strikePrices
Out[]=
True
Out[]=
True
In[]:=
putbidPrices=options["putExpDateMap"][janPutKey][#][[1]]["bid"]&/@strikeKeys;
In[]:=
putimpliedVol=options["callExpDateMap"][janPutKey][#][[1]]["volatility"]&/@strikeKeys;
In[]:=
g0=Plot[curprice-k,{k,500,1100},PlotStyle->{Black,Thin}];g1=ListPlot[{Transpose[{strikePrices,bidPrices}],Transpose[{strikePrices,-putbidPrices}]},PlotRange->All,Frame->True,FrameLabel->{"Strike Price","Price"},PlotLabel->"Call and Put Prices"];Show[g1,g0]
Out[]=
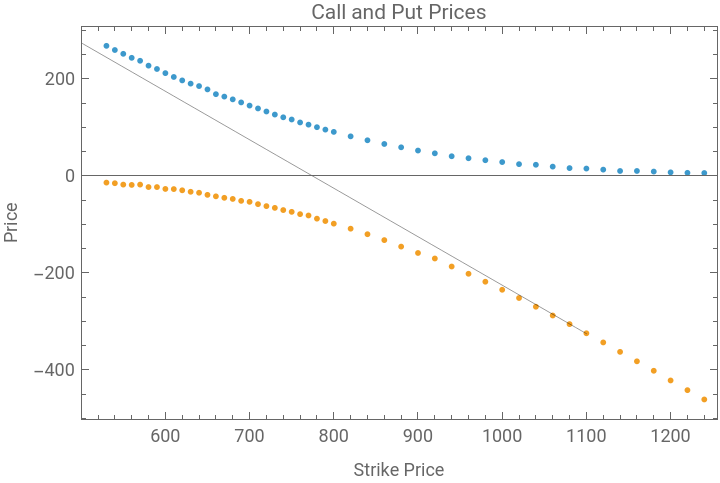
We need to pick a volatility to use pricing formulas. 800 looks like a good choice from the plot,
To get a better fit at the end of the curve use a higher strikeKey volatility.
Quote times in local timezone.
CITE THIS NOTEBOOK
CITE THIS NOTEBOOK
Structure of option chain from Schwab API
by Robert Rimmer
Wolfram Community, STAFF PICKS, May 8, 2025
https://community.wolfram.com/groups/-/m/t/3456945
by Robert Rimmer
Wolfram Community, STAFF PICKS, May 8, 2025
https://community.wolfram.com/groups/-/m/t/3456945