CITE THIS NOTEBOOK: Data analysis on the PTB-XL ECG dataset by Pedro Cabral. Wolfram Community FEB 9 2023.

ABSTRACT: In this article, I present a brief introduction to electrocardiograms: a diagnostic tool used to record the electrical impulses generated by the heart and evaluate its health, the PTB-XL Electrocardiography Dataset: a collection of ECG signals obtained from individuals diagnosed with various cardiovascular conditions. In this article, I also present the general data processing pipeline that is used to visualize ECG signals, which involves several key stages such as importing, preprocessing, and transforming.
A Brief Story of ECGs
A Brief Story of ECGs

The electrocardiogram (ECG) is a diagnostic tool that measures and records the electrical activity of the heart. It is used to detect and diagnose heart conditions, such as arrhythmias, heart attacks, and other heart disorders. The first ECG machine was invented in 1895 by Dutch physiologist Willem Einthoven. Today, ECGs are still used to diagnose heart conditions. They are also used to monitor the heart’s electrical activity during exercise or other activities.
Patients Importing and Preprocessing
Patients Importing and Preprocessing
The “PTB-XL” Electrocardiography Dataset
The “PTB-XL” Electrocardiography Dataset
The PTB-XL ECG dataset is a large dataset of 21799 clinical 12-lead ECGs from 18869 patients of 10 second length. The raw waveform data was annotated by up to two cardiologists, who assigned potentially multiple ECG statements to each record. The in total 71 different ECG statements conform to the SCP-ECG standard and cover diagnostic, form, and rhythm statements. In combination with the extensive annotation, this turns the dataset into a rich resource for the training and the evaluation of automatic ECG interpretation algorithms. The dataset is complemented by extensive metadata on demographics, infarction characteristics, likelihoods for diagnostic ECG statements as well as annotated signal properties.
Importing the Data
Importing the Data
Now, let’s begin the data importing and preprocessing to an adequate format for the Wolfram Language.
First, set the current working directory as the notebook directory.
In[]:=
(*ThisisimportantforimportingtheECGfiles.*)SetDirectory[NotebookDirectory[]];
All Patient Entries
All Patient Entries
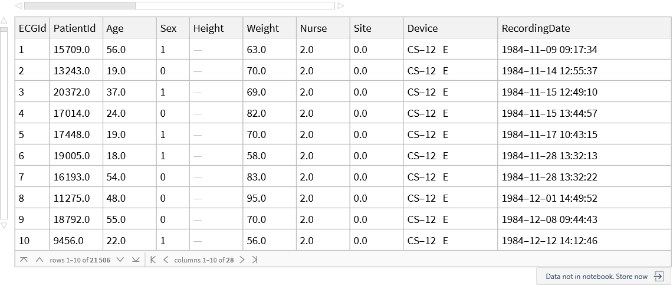
First, let’s import all of the patients data from the dataset CSV file.
Import the Patients Index CSV file, but exclude the header line.
In[]:=
patientsCSV=Import["./PTB-XL/ptbxl_database.csv","CSV",HeaderLines->1];
Now, lets replace all missing data that is represented by empty strings with the proper Missing[“NotAvailable”] format. Before
Dealing with Missing Data.
Dealing with Missing Data.
Trim all strings from the dataset.
In[]:=
patientsCSV=patientsCSV/.any_String:>StringTrim[any];
Replace all empty fields as a Missing[...] object.
In[]:=
patientsCSV=patientsCSV/.""->Missing["NotAvailable"];
Transforming the SCP-ECG as an Association
Transforming the SCP-ECG as an Association
In order for recognizing the sample features, it’s necessary to transform the “Standard Communications Protocol for Computer Assisted Electrocardiography” (SCP-ECG) JSON-like format into an Association, this can be done using the Developer`ReadRawJSONString function, since it’s considerably faster than the ImportString[..., “JSON”] function.
Transform each JSON-like value in the 12th column of “patientsCSV”.
In[]:=
patientsCSV[[All,12]]=Developer`ReadRawJSONString[StringReplace[#,{"'"->"\""}]]&/@patientsCSV[[All,12]]
Out[]=
Note that each code has a meaning. This function will be useful later for the analysis of each ECG.
Define the function “SCPToMeaning” as a function that takes an SCP-ECG code or association, and returns the description of the code, or an association of descriptions and percentages.
In[]:=
SCPToMeaning[any_Association]:=SCPToMeaning[#[[1]]]->Quantity[#[[2]],"Percent"]&/@Normal[any]SCPToMeaning[code_String]:=[[code]]
In[]:=
SCPToMeaning["IMI"80.`,"ISCLA"100.`,"PVC"100.`,"ABQRS"0.`,"SR"0.`]
Out[]=
Inferior Myocardial Infarction,Ischemic in Lateral Leads,Ventricular Premature Complex,Abnormal QRS,Sinus Rhythm
Transforming the “PatientsCSV” to a Dataset.
Transforming the “PatientsCSV” to a Dataset.
Now that the important data has been parsed, everything can be converted into an Association. This makes it easier for querying specific data and columns.
Create a dataset based on the “threading” of the column names with each row.
In[]:=
patientsCSV=DatasetAssociationThread,#&/@patientsCSV
Out[]=

Detecting and Deleting Outliers
Detecting and Deleting Outliers
Some fields can sometimes have quirky values. In this dataset, some patients happen to have 300 years. So lets delete these entries.
Select only the rows in which “Age” is lesser than 120.
In[]:=
patientsCSV=Query[Select[#Age<=120&]]@patientsCSV
Out[]=
Splitting the Dataset
Splitting the Dataset
Let’s also split the dataset into male and female patients.
In[]:=
malePatients=Normal@Query[Select[#Sex==0&]]@patientsCSV
Out[]=
Utility Functions
Utility Functions
If we want to get a patient entry based on the ECGId, we can use the following function. This function will be useful later on.
Define the function “PatientFromECGId” as the function that takes an ECG identifier and returns the entry info.
The following function will be useful later for the machine learning part.
Define the function “AllSCPCodes” as the function that merges all possible ECG-SCP codes outcomes in a single Association.
Data Visualization on the Dataset
Data Visualization on the Dataset
Now that we have the dataset with 21.799 entries, we can start asking some questions.
Plot a paired histogram of the ages of male and female patients.
Plot a paired histogram of the weight of male and female patients.
Plot a paired histogram of the height of male and female patients.
Parsing and Importing the ECG Signals
Parsing and Importing the ECG Signals
The “WaveForm Database (WFDB)” Format
The “WaveForm Database (WFDB)” Format
WaveForm Database signal files exist in several formats. Any of these formats can be used for multiplexed signal files, in which samples from two or more signals are stored alternately. In the PTB-XL ECG dataset, the data is stored in the “Format 16”. Each sample is represented by a 16-bit two’s complement amplitude stored least significant byte first. Any unused high-order bits are sign-extended from the most significant bit. With the addition of a logical EOF (octal 0100000) and null-padding after the logical EOF.
Function for Reading WFDB Files
Function for Reading WFDB Files
Let’s create a function that imports a “.dat” file, and automatically demultiplexes, and deletes the last two integers, since they are useless in our context.
Define the function “ReadWFDB” that automatically demultiplexes and deletes the last two integers of the given .wfdb or .dat binary file.
Also, a “Raw” variant of the function can exist for a faster and simpler.
Define the function “RawReadWFDB” that automatically demultiplexes and deletes the last two integers of the given .wfdb or .dat binary file.
Readings from the “FilenameLR” Field
Readings from the “FilenameLR” Field
Now that the “.dat” files can been demultiplexed, let’s create a function that reads files based on the ECGId field.
Define the function “WFDBFromId” that calls the function ReadWFDB on an assembled path.
As well as “RawReadWFDB”, a “RawWFDBFromId” can exist as well.
Define the function “RawWFDBFromId” that calls the function ReadWFDB on an assembled path.
Plotting and Visualizing the ECGs
Plotting and Visualizing the ECGs
With everything prepared, we can start visualizing the ECGs.
Define the function “PlotECG” that computes twelve DateListPlot for each ECG TimeSeries.
Next Steps
Next Steps
Given the rich and diverse nature of the PTB-XL Electrocardiography Dataset, there is vast potential for further analysis and exploration. One important avenue of future work is the application of machine learning techniques to the ECG signals contained in the dataset. Machine learning algorithms can be trained on large datasets such as the PTB-XL to detect patterns and anomalies in ECG signals, classify ECG signals into different categories, and make predictions about heart health.
Another potential avenue of exploration is the integration of ECG signals with other physiological data, such as blood pressure and respiratory rate, to gain a more comprehensive understanding of the patient’s overall health. This could enable the identification of correlations and causations between different physiological parameters, particularly useful in the assessment of patients with complex cardiovascular conditions.
In conclusion, the potential for further analysis and exploration of the PTB-XL Electrocardiography Dataset is vast and exciting, with the application of machine learning techniques, the integration of ECG signals with other physiological data, and the development of wearable ECG devices being just a few of the many promising avenues for future research.
Bibliography and References
Bibliography and References
[1] Wagner, P., Strodthoff, N., Bousseljot, R., Samek, W., & Schaeffter, T. (2022). PTB-XL, a large publicly available electrocardiography dataset (version 1.0.3). PhysioNet. https://doi.org/10.13026/kfzx-aw45.
[2] Wagner, P., Strodthoff, N., Bousseljot, R.-D., Kreiseler, D., Lunze, F.I., Samek, W., Schaeffter, T. (2020), PTB-XL: A Large Publicly Available ECG Dataset. Scientific Data. https://doi.org/10.1038/s41597-020-0495-6
[3] Goldberger, A., Amaral, L., Glass, L., Hausdorff, J., Ivanov, P. C., Mark, R., ... & Stanley, H. E. (2000). PhysioBank, PhysioToolkit, and PhysioNet: Components of a new research resource for complex physiologic signals. Circulation [Online]. 101 (23), pp. e215–e220.