In the present notebook, the two codes cover different interventions, and thereby also introduce two different ways of modeling the implementation of interventions during an outbreak . Remember that so far, we have only represented interventions like vaccination and treatment to be implemented from the start of the simulation, before the beginning of the outbreak . However, in reality, an infection is often already established or an outbreak has begun before control measures are taken . In each case, the code is for the dengue model you developed in the previous activity, but with the addition of a vector control intervention .
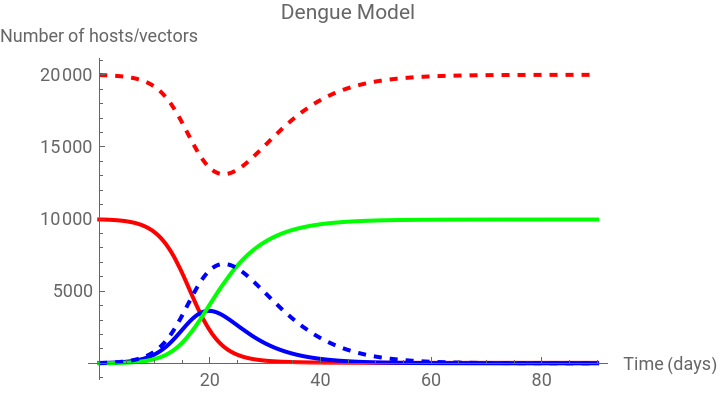
The 1 represents an example of an intervention that changes the value of parameter over time, and the 2 is an example of an intervention that instantaneously affects the population at a specific time point . Examine and interpret the dengue model code in each cell and answer the corresponding questions . For comparison purposes, here is the output from the dengue model without interventions from the previous notebook:
The 1 represents an example of an intervention that changes the value of
a
In[]:=
Clear["Global`*"]
Parameters and initial conditions
nh=10000;(*Totalnumberofhosts*)nv=20000;(*Totalnumberofvectors*)
In[]:=
initialConditions={sh[0]==nh-0.0028*nh,ih[0]==0.0028*nh,rh[0]==0,sv[0]==nv-0.00057*nv,iv[0]==0.00057*nv};
parameters={a=1,(*Mosquitobitingrateperday*)bv=0.4,(*Probabilityofinfectionfromaninfectedhosttoasusceptiblevector*)bh=0.4,(*Probabilityofinfectionfromaninfectedvectortoasusceptiblehost*)uv=0.25,(*Mortality/recruitmentrateofthevector*)r=0.167(*Recoveryratefromdengueinhumans*)};
Differential equations
equations={sh'[t]==-a*bh*sh[t]*iv[t]/nh,ih'[t]==a*bh*sh[t]*iv[t]/nh-r*ih[t],rh'[t]==r*ih[t],sv'[t]==uv*nv-a*bv*sv[t]*ih[t]/nh-uv*sv[t],iv'[t]==a*bv*sv[t]*ih[t]/nh-uv*iv[t]};
Solve the system of differential equations
sol=NDSolve[{equations,initialConditions},{sh,ih,rh,sv,iv},{t,0,90}];
In[]:=
Plot[Evaluate[{sh[t],ih[t],rh[t],sv[t],iv[t]}/.sol],{t,0,90},PlotLegends->{"Susceptible Humans","Infected Humans","Recovered Humans)","Susceptible Mosquitoes","Infected Mosquitoes"},PlotStyle->{{Thick,Red},{Thick,Blue},{Thick,Green},{Dashed,Red},{Dashed,Blue},{Dashed,Green}},PlotLabel->"Dengue Model",AxesLabel->{"Time (days)","Number of hosts/vectors"}]
Out[]=


Intervention 1:
Intervention 1:
In[]:=
Clear["Global`*"]
Parameters and initial conditions
nh=10000;(*Totalnumberofhosts*)nv=20000;(*Totalnumberofvectors*)
In[]:=
initialConditions={sh[0]==nh-0.0028*nh,ih[0]==0.0028*nh,rh[0]==0,sv[0]==nv-0.00057*nv,iv[0]==0.00057*nv};(*Defineafunctionfor'a'basedonsomecondition*)getA[t_]:=If[t<=15,1,If[t<=60,0.25,1]];
In[]:=
parameters={bv=0.4,(*Probabilityofinfectionfromaninfectedhosttoasusceptiblevector*)bh=0.4,(*Probabilityofinfectionfromaninfectedvectortoasusceptiblehost*)uv=0.25,(*Mortality/recruitmentrateofthevector*)r=0.167(*Recoveryratefromdengueinhumans*)};
Differential equations
equations={sh'[t]==-getA[t]*bh*sh[t]*iv[t]/nh,ih'[t]==getA[t]*bh*sh[t]*iv[t]/nh-r*ih[t],rh'[t]==r*ih[t],sv'[t]==uv*nv-getA[t]*bv*sv[t]*ih[t]/nh-uv*sv[t],iv'[t]==getA[t]*bv*sv[t]*ih[t]/nh-uv*iv[t]};
Solve the system of differential equations
sol=NDSolve[{equations,initialConditions},{sh,ih,rh,sv,iv},{t,0,90}];
In[]:=
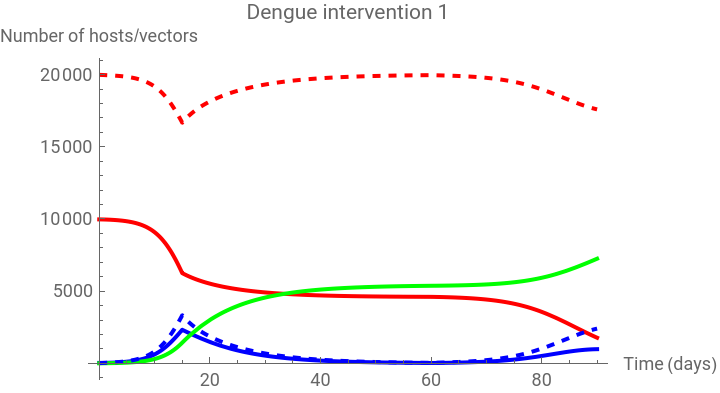
Plot[Evaluate[{sh[t],ih[t],rh[t],sv[t],iv[t]}/.sol],{t,0,90},PlotLegends->{"Susceptible Humans","Infected Humans","Recovered Humans)","Susceptible Mosquitoes","Infected Mosquitoes"},PlotStyle->{{Thick,Red},{Thick,Blue},{Thick,Green},{Dashed,Red},{Dashed,Blue},{Dashed,Green}},PlotLabel->"Dengue intervention 1",AxesLabel->{"Time (days)","Number of hosts/vectors"}]
Out[]=
Based on the code, what effect does the intervention have on the natural history of the infection and how effective is it at this?
Based on the code, what effect does the intervention have on the natural history of the infection and how effective is it at this?
The modelled interventions works by reducing the biting rate during a given time period (between days 15 and 60) . It has a 75 % efficacy at reducing the biting rate (from 1 per day to 0.25 per day) .
a
Give an example of an intervention this might represent and describe in more detail how it is implemented in the code (e . g . when, for how long) .
Give an example of an intervention this might represent and describe in more detail how it is implemented in the code (e . g . when, for how long) .
This might represent implementation of a personal protective intervention on the population level, e . g . rolling out an insect repellent scheme to all individuals in the modelled community, which would reduce the biting rate on humans . At the beginning of the simulation and until the timestep corresponding to day 15, . From the plot we can see that a dengue outbreak has started by that time . At day 15, the insect repellent is distributed and assumed to reduce the biting rate to 0.25 per day . Use of insect repellent is maintained for 45 days, but stops at day 60 so the biting rate increases again to its baseline value .
a1day
-1
s
Based on the plot, how does the intervention affect the prevalence of infection in humans?
Based on the plot, how does the intervention affect the prevalence of infection in humans?
Compared to the scenario without intervention, the peak of the dengue outbreak occurs slightly earlier and is lower . However, the output at the later timesteps also shows that as soon as the intervention is no longer in effect, the number of infections in humans starts rising again .
Intervention 2 :
Intervention 2 :
In[]:=
Clear["Global`*"]
Parameters and Initial Conditions
nh=10000;(*Totalnumberofhosts*)nv=20000;(*Totalnumberofvectors*)initialConditions={sh[0]==nh-0.0028*nh,ih[0]==0.0028*nh,rh[0]==0,sv[0]==nv-0.00057*nv,iv[0]==0.00057*nv};
In[]:=
parameters={a=1,(*Mosquitobitingrateperday*)bv=0.4,(*Probabilityofinfectionfromaninfectedhosttoasusceptiblevector*)bh=0.4,(*Probabilityofinfectionfromaninfectedvectortoasusceptiblehost*)uv=0.25,(*Mortality/recruitmentrateofthevector*)r=0.167(*Recoveryratefromdengueinhumans*)};
Differential equations
equations={sh'[t]==-a*bh*sh[t]*iv[t]/nh,ih'[t]==a*bh*sh[t]*iv[t]/nh-r*ih[t],rh'[t]==r*ih[t],sv'[t]==uv*nv-a*bv*sv[t]*ih[t]/nh-uv*sv[t],iv'[t]==a*bv*sv[t]*ih[t]/nh-uv*iv[t]};
Define the time at which the intervention occurs
interventionTime=15;(*ApplytheinterventionbyreducingSvandIvby50%atinterventionTime*)solWithIntervention=NDSolve[{equations,initialConditions,WhenEvent[t>=interventionTime,{sv[t]->0.5*sv[t],iv[t]->0.5*iv[t]}]},{sh,ih,rh,sv,iv},{t,0,90}];(*Plottheupdatedsolutionwithintervention*)Plot[Evaluate[{sh[t],ih[t],rh[t],sv[t],iv[t]}/.solWithIntervention],{t,0,90},PlotLegends->{"Susceptible Humans","Infected Humans","Recovered Humans)","Susceptible Mosquitoes","Infected Mosquitoes"},PlotStyle->{{Thick,Red},{Thick,Blue},{Thick,Green},{Dashed,Red},{Dashed,Blue},{Dashed,Green}},PlotLabel->"Dengue intervention 2",AxesLabel->{"Time (days)","Number of hosts/vectors"}]
Out[]=
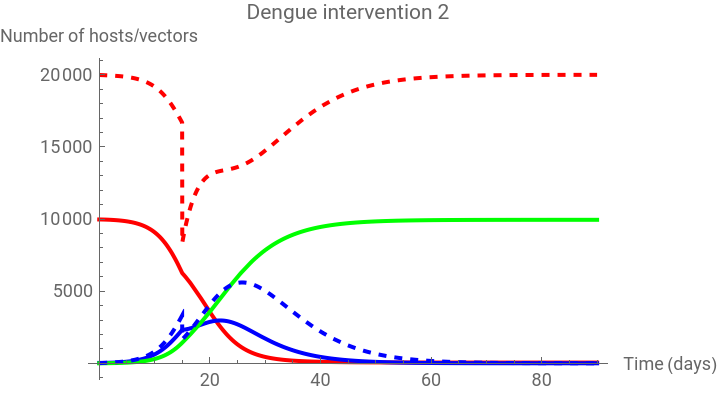
we are changing the number of susceptible vectors () and the number of infected vectors ), both at timestep 15. We are multiplying the number in those states at that timepoint by 0.5, which means we are modeling an intervention with 50 % efficacy at reducing the vector population in the community .
S
v
(
I
v
The plot also shows that right after the fogging event, the mosquito population slowly increases again, as new mosquitoes are recruited into the population through maturation of larvae (as defined in the parameter) . This is because the mosquito larvae are not killed by fogging .
μ
v
CITE THIS NOTEBOOK
CITE THIS NOTEBOOK
Dengue model and two scenarios of intervention
by Athanasios Paraskevopoulos
Wolfram Community, STAFF PICKS, September 18, 2023
https://community.wolfram.com/groups/-/m/t/3015351
by Athanasios Paraskevopoulos
Wolfram Community, STAFF PICKS, September 18, 2023
https://community.wolfram.com/groups/-/m/t/3015351