Flory-Huggins Phase Diagram of Polymer Mixing
Flory-Huggins Phase Diagram of Polymer Mixing


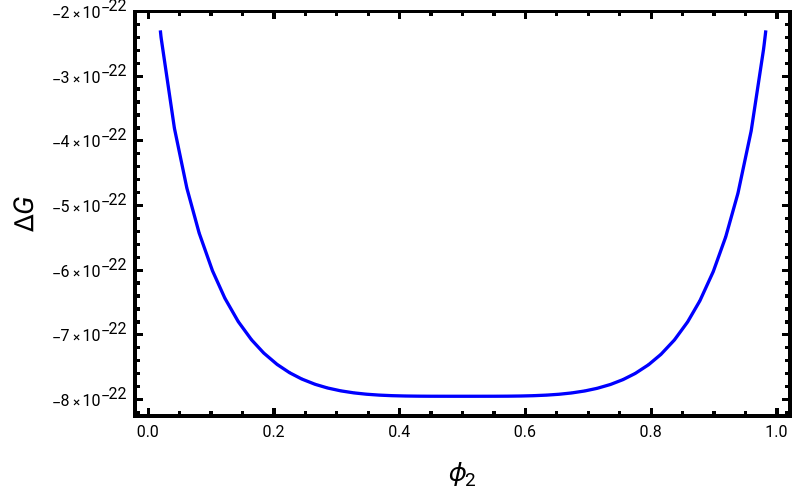
This Demonstration shows Flory–Huggins polymer mixing with the simultaneous visualization of the free-energy curves of mixing and the resulting phase diagram. Here is the total Flory free-energy equation of mixing for polymers[1]:
Δ
G
mix
N
0
ϕ
1
ϕ
2
ϕ
1
x
1
ϕ
1
ϕ
2
x
2
ϕ
2
where is the molar quantity of the change in free energy upon mixing of polymers, is the Boltzmann constant , is temperature, kept constant at , is the energy of the interaction between the components mixed, is the volume fraction of polymer 1, is the volume fraction of polymer 2, is the degree of polymerization of polymer 1 and is the degree of polymerization of polymer 2.
G
mix
N
0
k
1.38
-23
10
J
K
T
298K
χ
ϕ
1
ϕ
2
x
1
x
2
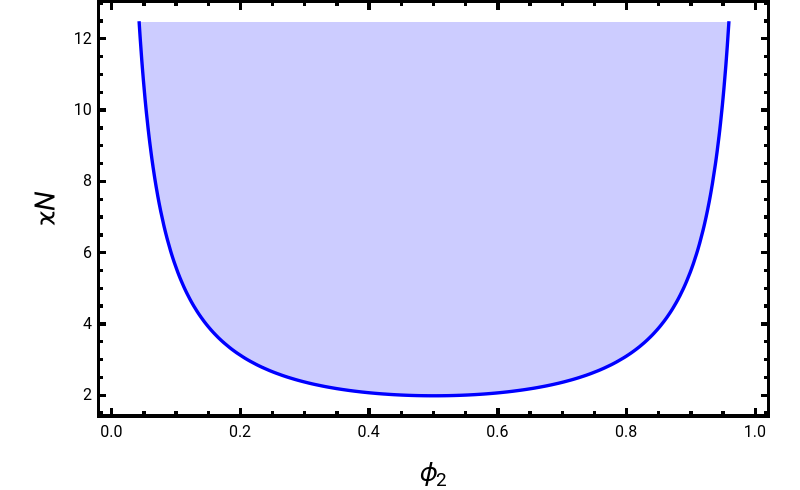
The free energy of the mixing curve and phase diagram (top) changes as a function of the parameter and the degree of polymerization of the binary mixture (those being and ). Additionally, the phase diagram is plotted in terms of . The shaded region of the polymer phase diagram (bottom) indicates the phase-separated, or two-phase, regime.
χ
x
1
x
2
χN
References
References
[1] J. P. Steimel, "Polymers and Composite Materials," Pacific Open Texts, 2022 18. scholarlycommons.pacific.edu/open-textbooks/18.
External Links
External Links
Permanent Citation
Permanent Citation
Sol Wright, Joshua Paul Steimel
"Flory-Huggins Phase Diagram of Polymer Mixing"
http://demonstrations.wolfram.com/FloryHugginsPhaseDiagramOfPolymerMixing/
Wolfram Demonstrations Project
Published: August 26, 2024