This code implements a genetic algorithm for the bi-objective optimization of a truss structure. The script aims to simultaneously minimize the structure’s weight and the displacement at a specific point under two applied loads. The optimization selects one of three predefined diameters for each bar, identifying a set of trade-off solutions (Pareto Front) that balance lightness and rigidity.
Wolfram Virtual HackathonAuthors: Diego Leonan P. Alves (Amazon State University, dlpa.eng22@uea.edu.br) Samhira Consuelo (Amazon State University, scdsrp.eng21@uea.edu.br) Filipe Menezes (Amazon State University, fmdc.eng21@uea.edu.br) Pedro Augusto (Amazon State University, pavv.eng21@uea.edu.br ) Supervisor: Rubelmar Maia de Azevedo Cruz Neto, PhD
Calculation of deformation and mass
Calculation of deformation and mass
In this section, the internal forces of each truss member are first determined using the method of joints, ensuring an accurate evaluation of the axial forces in the real structure. Next, the internal forces of the virtual structure are computed by applying a negative vertical load at the specific node where the displacement is to be evaluated. This procedure follows the principle of virtual work, allowing the nodal displacement to be obtained from the compatibility between the real and virtual internal forces.
After the structural analysis, the masses of the 13 bars are calculated. The code iterates through each element, identifies its corresponding diameter, and determines the specific linear density. For each bar, the length is multiplied by the associated density, and the result is accumulated until the total mass of the truss is obtained. Finally, the total mass is combined with the global deformation, forming the pair {deformation, mass}, which is used to assess the quality of the structural solution through the Genetic Algorithm’s fitness function.
After the structural analysis, the masses of the 13 bars are calculated. The code iterates through each element, identifies its corresponding diameter, and determines the specific linear density. For each bar, the length is multiplied by the associated density, and the result is accumulated until the total mass of the truss is obtained. Finally, the total mass is combined with the global deformation, forming the pair {deformation, mass}, which is used to assess the quality of the structural solution through the Genetic Algorithm’s fitness function.
Code
Code
Genetic Algorithm
Genetic Algorithm
In this section, a Genetic Algorithm is employed with the purpose of evolving the population of trusses and identifying the optimal structural configuration. The initial population consists of trusses with different combinations of lengths and diameters, and each individual is evaluated using a bi-objective fitness function that simultaneously considers the total mass and the displacement at the point of interest. These two criteria have distinct weights in the evaluation: displacement may be defined as more important than mass, allowing heavier trusses to be considered superior if they exhibit smaller displacements.
Selection is performed using the roulette wheel method, followed by the application of the crossover operator to combine the parents’ characteristics. Random mutations are introduced to maintain genetic diversity within the population. This process is repeated over several generations, adopting elitism to ensure that the best individual of each epoch is preserved.
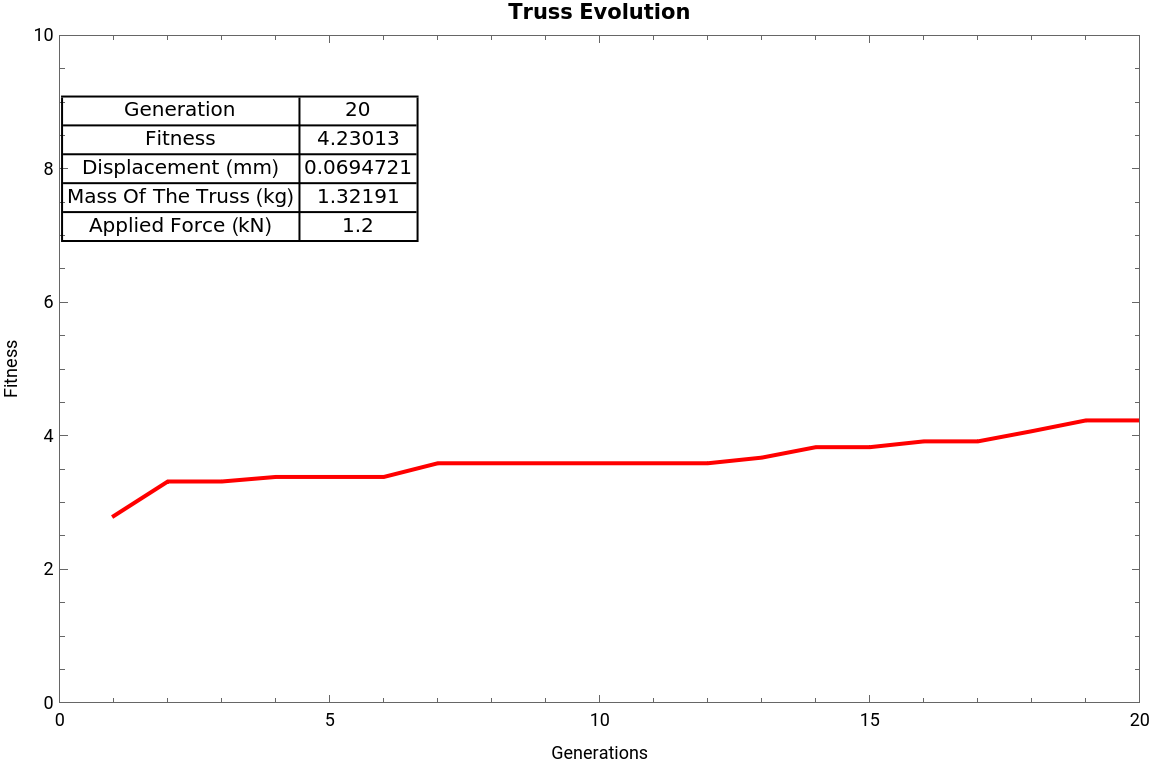
The generated plot displays, for each epoch (generation), a table embedded directly within the visualization, showing the values associated with the best individual of that generation. The central idea is to maximize the bi-objective function, seeking the best balance between stiffness (reduced displacement) and lightness (reduced mass), according to the chosen weights.
Code
Code
Figure
Figure
In[]:=
GA[20, 20, 0.1, 1.5]
Out[]=

2D Graph
2D Graph
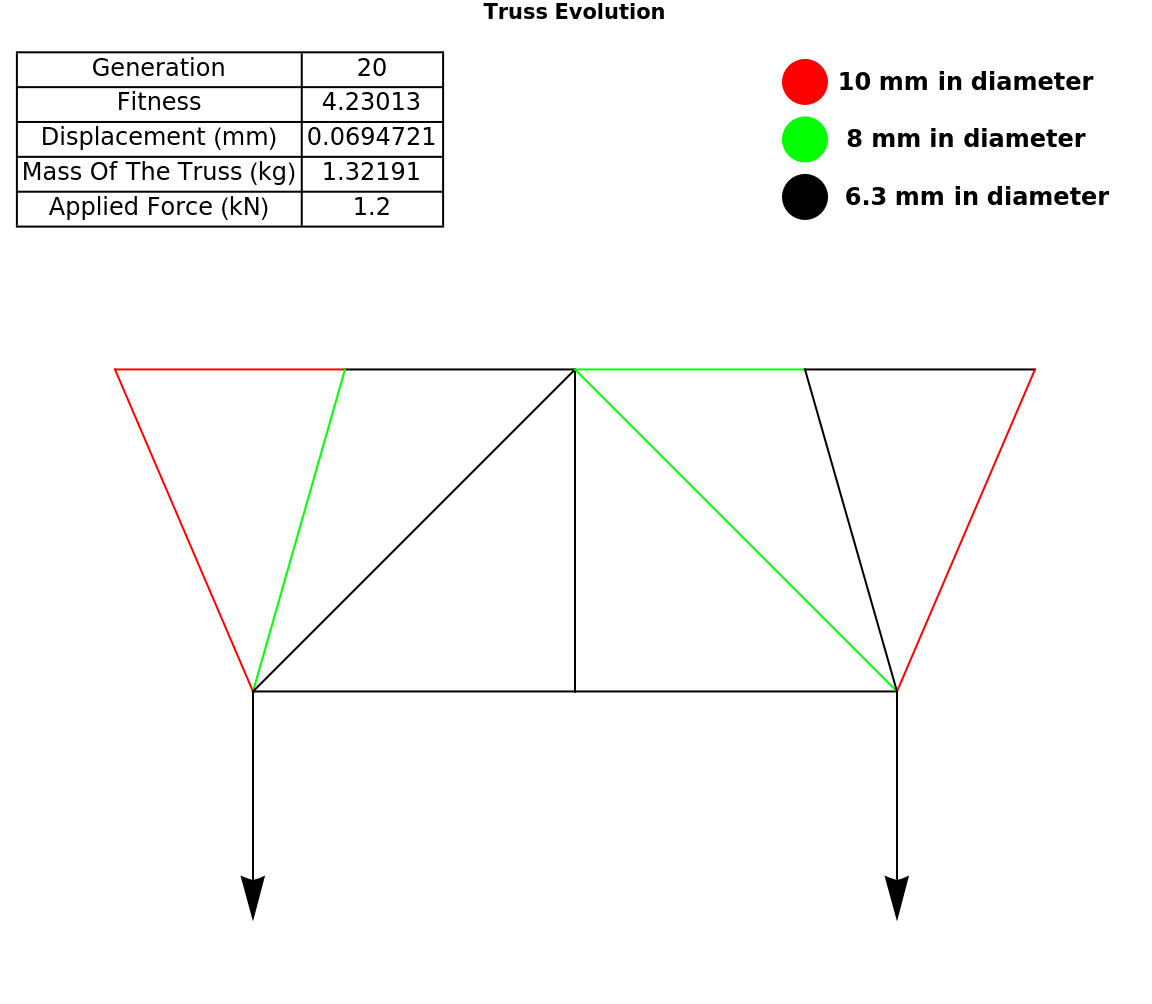
Supplementing the Genetic Algorithm methodology described in the preceding section, the graph2D visualization function was created to facilitate the analysis of the solutions’ evolution. It receives a generation number (Epoch) as input and renders a technical diagram of the truss structure corresponding to the fittest individual in that population. This visual representation utilizes a color key (red, green, and black) to display the varying diameters of each bar, providing an intuitive understanding of how the algorithm has optimized the material distribution.
Code
Code
Figure
Figure
In[]:=
graph2D[20]
Out[]=
3D Graph
3D Graph
In this version, the truss members are rendered as three-dimensional Tube objects, where the radius of each tube visually represents the solution’s actual diameter. Interactivity is the central feature: a slider control allows the user to navigate between generations (Epochs), and the 3D model is instantly reconstructed to reflect the fittest solution of that stage. To enhance spatial perception, the camera’s viewpoint is dynamically altered as the generation changes, creating a continuous rotation effect. The color scheme for the diameters and the table with performance data are maintained, ensuring consistency in the presentation of results.
Code
Code
Figure
Figure
In[]:=
graph3D
Out[]=


Manipulate
Manipulate
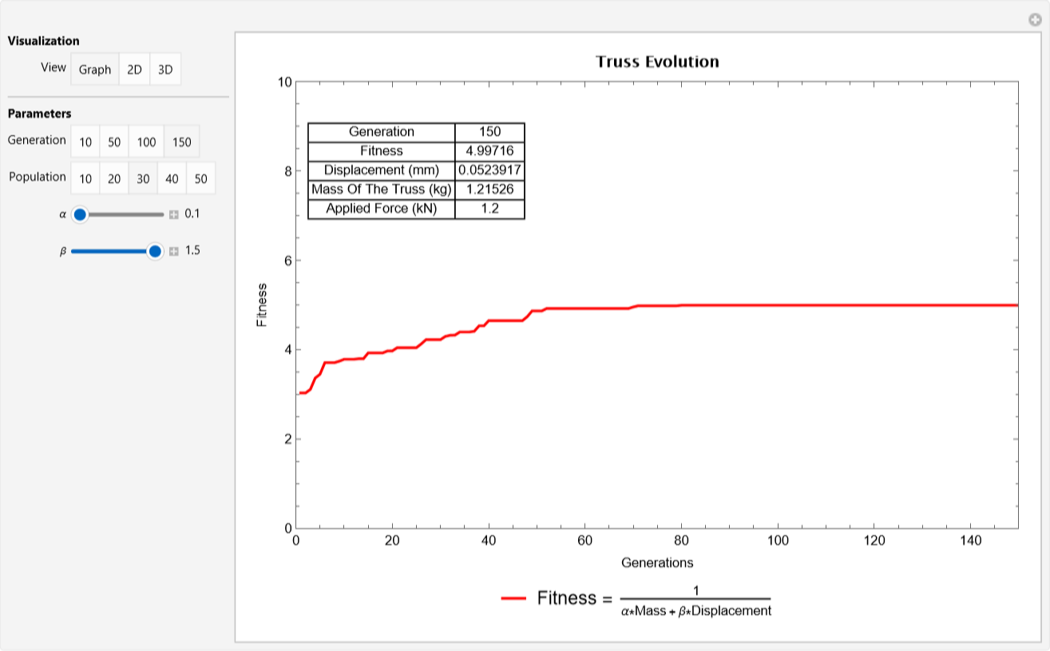
This code creates a unified simulation and analysis dashboard using the Manipulate function. It consolidates control over the Genetic Algorithm’s parameters and the display of its results into a single graphical user interface (GUI). A central ‘View’ selector organizes the functionality, letting the user switch between three operational modes: the ‘Graph’ mode is for running and analyzing the Genetic Algorithm’s performance, where all hyperparameters (Generation, Population, α, β) are active for experimenting with various settings. The ‘2D’ mode focuses on the static analysis of a particular solution, rendering the 2D diagram of the optimized truss for a selected generation. Lastly, the ‘3D’ mode launches the dynamic 3D visualization environment, enabling interactive and animated inspection of the structure’s evolution over the generations.
In[]:=
Manipulate[Which[View "Graph",GA[Generation, Population, α, β],View "2D",graph2D[Generation],View "3D",graph3D],Style["Visualization", Bold],{View,{"Graph", "2D", "3D"}},Delimiter,Style["Parameters", Bold],{{Generation, 150}, {10, 50, 100, 150}, Enabled (View == "Graph" || View == "2D")},{{Population, 30}, {10, 20, 30, 40, 50}, Enabled View "Graph"},{{α, .1}, .1, 0.5, Appearance -> "Labeled", ImageSizeTiny, Enabled View "Graph"},{{β, 1.5}, .3, 1.5, Appearance -> "Labeled", ImageSizeTiny, Enabled View "Graph"},ControlPlacementLeft]
Out[]=
CITE THIS NOTEBOOK
CITE THIS NOTEBOOK
Truss structure optimization using a genetic algorithm
by Diego Alves
Wolfram Community, STAFF PICKS, November 14, 2025
https://community.wolfram.com/groups/-/m/t/3574743
by Diego Alves
Wolfram Community, STAFF PICKS, November 14, 2025
https://community.wolfram.com/groups/-/m/t/3574743