Wolfram Model Evolution Animation
Wolfram Model Evolution Animation
Dugan Hammock
Quantum Gravity Research
We demonstrate a novel method for plotting and animating the evolutions of spatial hypergraphs for Wolfram Models. Typically, hypergraphs in a WolframModel are plotted in 2D using WolframModelPlot, which converts the hypergraph into a graph and uses HypergraphPlot with the GraphLayout option “SpringElectricalEmbedding” to assign vertex coordinates in the plane. One issue with HypergraphPlot is that the placement of the vertices may jump wildly between updating events. We implement a new method which mantains positional cohesion for vertices which persist between event states. We also implement a function to stack the 2D states plots into a 3D graphic where the updating events are highlighted.
Graphs and Hypergraphs
Graphs and Hypergraphs
Graphs
Graphs
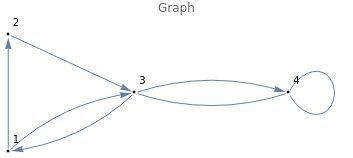
A graph, , consists of a set of vertices, , and a set of edges, , which are pairs of vertices, serving the role of connections or links between “adjacent” vertices. Edges are allowed to be ordered, , or unordered, . We allow for edges to list vertices with multiplicities (edges are multi-sets), which for graphs allows for unary edges connecting a vertex to itself. We also allow for repeated edges (E is a multi-set).
G
V={,…,}
v
1
v
n
E
e={,}
v
i
v
j
v
i
v
j
v
i
v
j
e={,}
v
i
v
i
Module[{vertices,edges,graph},vertices = {1,2,3,4};edges = {12,23,31,13,34,34,44};graph = Graph[vertices,edges];GraphPlot[graph,VertexLabelsAll,VertexShapeFunction"Point",VertexStyleBlack,PlotLabel"Graph"]]
Hypergraphs
Hypergraphs
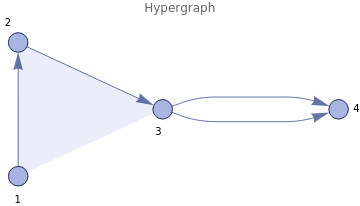
A hypergraph, , consists of a set of vertices, , and a set of hyperedges, , where each hyperedge, may contain any number of vertices and possibly with multiplicity. We also allow for repeated edges.
H
V
E⊂(V)
e={,…,}
v
i
1
v
i
k
The resource function WolframModelPlot, part of the SetReplace package, is what we will use to plot hypergraphs.
Note: There is a function in SetReplace which is called HypergraphPlot which should not be confused with the resource function ResourceFunction[“HypergraphPlot”].
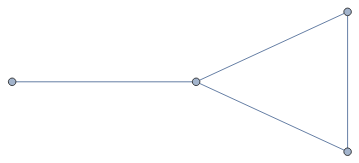
Under the hood, WolframModelPlot converts the input hypergraph into a graph (by splitting up hyperedges into edges) and uses the function GraphEmbedding to determine the positions of the vertices.
Note: There is a function in SetReplace which is called HypergraphPlot which should not be confused with the resource function ResourceFunction[“HypergraphPlot”].
Under the hood, WolframModelPlot converts the input hypergraph into a graph (by splitting up hyperedges into edges) and uses the function GraphEmbedding to determine the positions of the vertices.
Spring-Electrical-Embedding
Spring-Electrical-Embedding
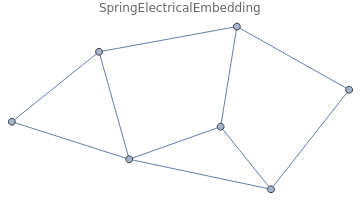
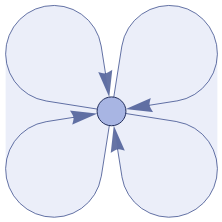
The default value for the GraphLayout option is “SpringElectricalEmbedding”.
With this setting, GraphEmbedding determines the vertex coordinates for the vertices of a graph by running a particle simulation on the vertices.
Each particle is simulated to have a uniform negative electrical charge and creating a repulsive force with a quadratic dropoff.
The edges of the graph are treated as springs with unit restoring distance.
Graph[{{1,4},{1,2},{2,3},{1,3}},GraphLayout"SpringElectricalEmbedding"]
Other Embeddings
Other Embeddings
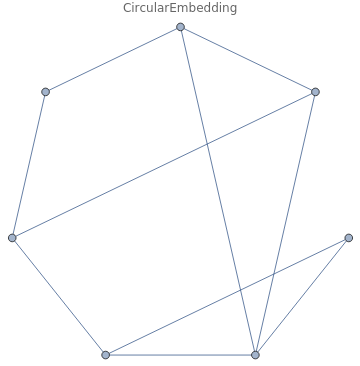
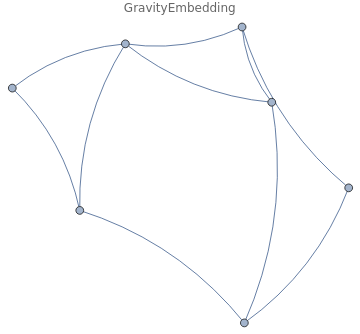
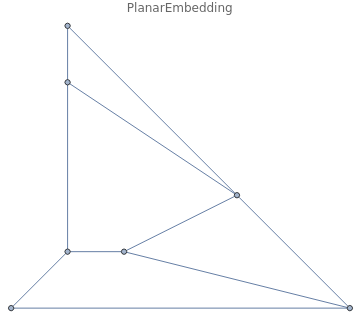
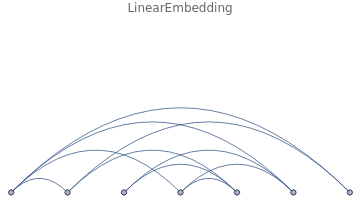
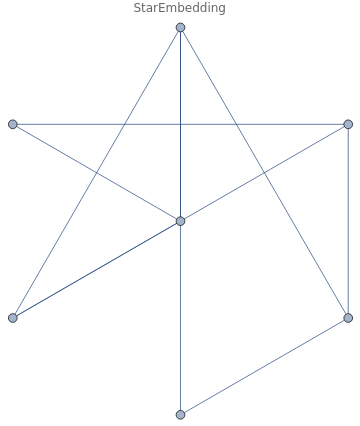
GraphEmbedding offers many options for GraphLayout.
graph = RandomGraph[{7,10}];GraphPlot[graph,GraphLayout#,PlotLabel#]&/@{"SpringElectricalEmbedding","PlanarEmbedding","CircularEmbedding","LinearEmbedding","GravityEmbedding","StarEmbedding"} // Multicolumn
Evolution of a Wolfram Model
Evolution of a Wolfram Model
WolframModelEvolutionObject
WolframModelEvolutionObject
ResourceFunction[“WolframModel”][ rules, init, t ] outputs a WolframModelEvolutionObject[…data…], which contains an Association with all the data computed of the evolution of the initial hypergraph, init, using replacement operations given by rules, up to the termination condition t.
We use this data object and its available properties to construct a 3D visualization of the evolution history of the (spatial) hypergraph of the WolframModel.
We use this data object and its available properties to construct a 3D visualization of the evolution history of the (spatial) hypergraph of the WolframModel.
evolution = [ {{1,1,2},{1,3,4}} {{4,4,5},{5,4,2},{3,2,5}}, {{1,1,1},{1,1,1}}, <|"MaxEvents" 20|> ];
Properties
Properties
While it is possible to extract the Association and get its data, the WolframModelEvolutionObject is defined with certain properties available.
evolution["Properties"] // Sort // Multicolumn[#,4]&
AllEventsCount | EdgeCreatorEventIndices | FinalEdgeCount | Properties |
AllEventsDistinctElementsCount | EdgeDestroyerEventIndices | FinalState | Rules |
AllEventsEdgesCount | EdgeDestroyerEventsIndices | FinalStatePlot | StateAfterEvent |
AllEventsEdgesList | EdgeGenerationsList | Generation | StateEdgeIndicesAfterEvent |
AllEventsGenerationsList | EventsStatesList | GenerationComplete | StatesList |
AllEventsList | EventsStatesPlotsList | GenerationEdgeIndices | StatesPlotsList |
AllEventsRuleIndices | EvolutionObject | GenerationEventsCountList | TerminationReason |
AllEventsStatesEdgeIndicesList | ExpressionsEventsGraph | GenerationEventsList | TotalGenerationsCount |
AllEventsStatesList | ExpressionsSeparation | GenerationsCount | Version |
CausalGraph | FeatureAssociation | LayeredCausalGraph | VertexCountList |
CompleteGenerationsCount | FeatureVector | MultiwayQ | |
EdgeCountList | FinalDistinctElementsCount | PartialGenerationsCount | |
Event States
Event States
evolution["AllEventsStatesList"] // Map
,
,
,
,
,
,
,
,
,
,
,
,
,
,
,
,
,
,
,
,
Plotted Vertices Jump Around
Plotted Vertices Jump Around
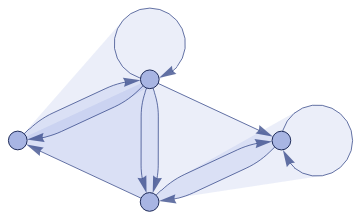
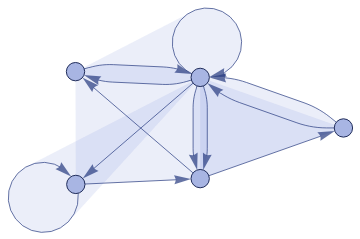
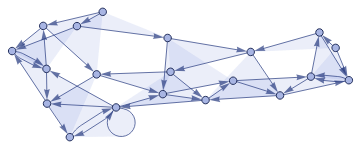
We can use the VertexLabels option for WolframModelPlot to keep track the plotted positions of certain vertices.
In the following example, we can see that vertex 1 jumps sometimes from from left to right between successive events.
In the following example, we can see that vertex 1 jumps sometimes from from left to right between successive events.
2D Plots of Events
2D Plots of Events
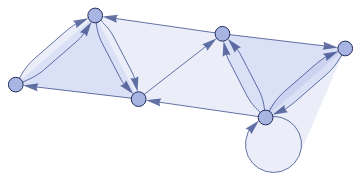
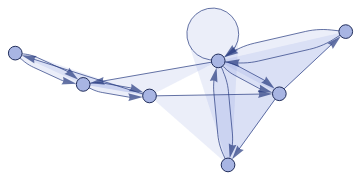
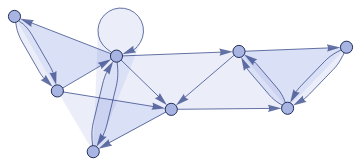
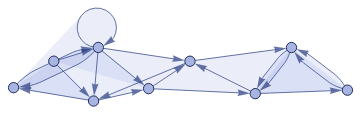
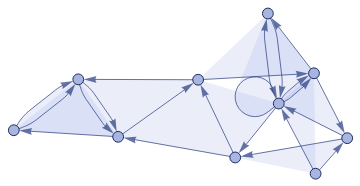
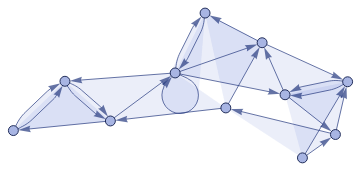
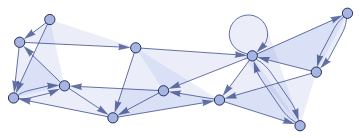
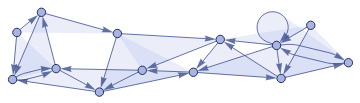
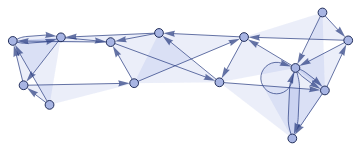
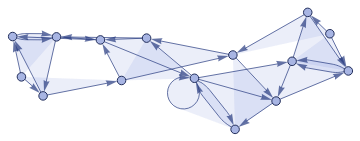
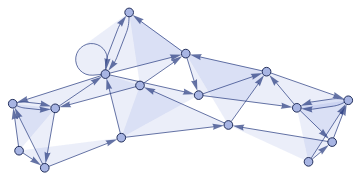
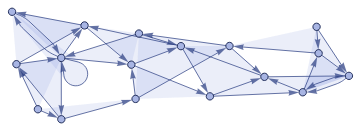
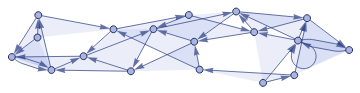
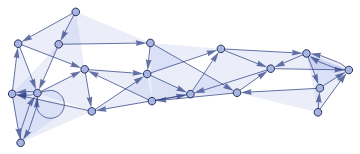
The property “EventsStatesPlotsList” returns a similar list of 2D plots of each hypergraph state in the list “AllEventsStatesList”, with special styling to indicate the actions of the events.
In each state plot, the hyperedges that are about to be destroyed by the next event (matched by the input of the event’s rule) is rendered in gray with dotted edges.
The hyperedges that have been created by an event are rendered in red with thick edges.
In each state plot, the hyperedges that are about to be destroyed by the next event (matched by the input of the event’s rule) is rendered in gray with dotted edges.
The hyperedges that have been created by an event are rendered in red with thick edges.
3D Plot of All Event States
3D Plot of All Event States
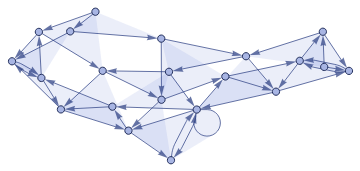
Temporal Cohesion for Persistant Vertices
Temporal Cohesion for Persistant Vertices
WolframModelEvolutionPlot3D (example)
WolframModelEvolutionPlot3D (example)
WolframModelEvolutionAnimation (example)
WolframModelEvolutionAnimation (example)
Examples
Examples
example 1
example 1
example 2
example 2
example 3
example 3
example 4
example 4
example 5
example 5
Concluding remarks
Concluding remarks
This is a good result with a concise method.
The implementation can, in principle, be extended to 3D plots as well (where the SpringElectricalEmbedding is solved in 4D).
Also, the styling of the animation and plots can be improved, and options can be implemented to the function to make it more extensible to the end user.
The implementation can, in principle, be extended to 3D plots as well (where the SpringElectricalEmbedding is solved in 4D).
Also, the styling of the animation and plots can be improved, and options can be implemented to the function to make it more extensible to the end user.
Keywords
Keywords
◼
WolframModel
◼
Hypergraph
◼
HypergraphPlot
Acknowledgment
Acknowledgment
Special thanks to Hatem Elshatlawy, for his guidance and support during the Summer School.
I am also grateful for Max Piskunov for his help and for documenting his SetReplace repository so thoroughly.
A personal thank you goes out to Stephen, for his excitement and infectious enthusiasm, and to all instructors and TA’s who helped make the Wolfram Summer Program possible.
I am also grateful for Max Piskunov for his help and for documenting his SetReplace repository so thoroughly.
A personal thank you goes out to Stephen, for his excitement and infectious enthusiasm, and to all instructors and TA’s who helped make the Wolfram Summer Program possible.
References
References