The tornado outlook of 15th of July 2024 as published by NOAA and available on this website:
https://www.spc.noaa.gov/products/outlook/archive/2024/day1otlk_20240715_2000.html
https://www.spc.noaa.gov/products/outlook/archive/2024/day1otlk_20240715_2000.html
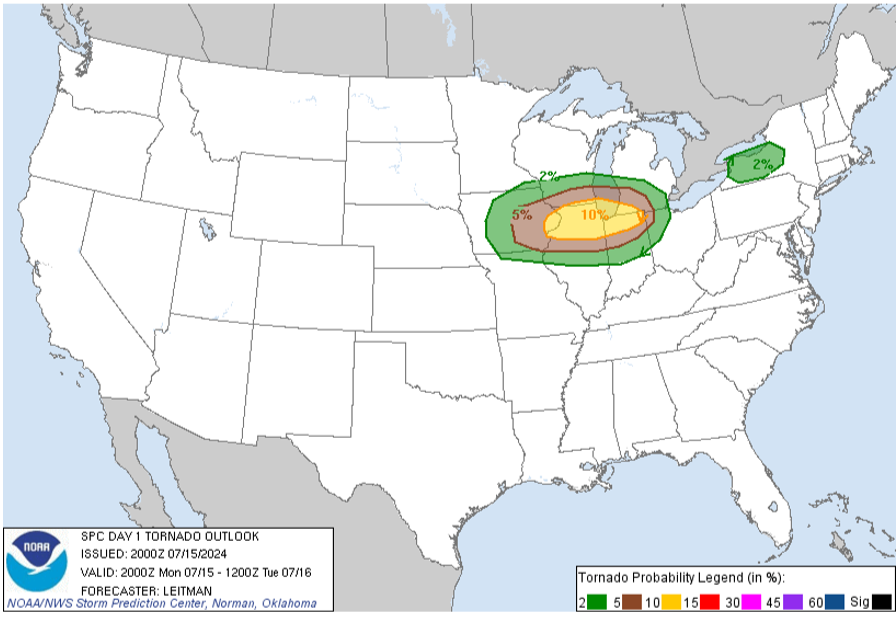
Since the color scheme begins with green, brown, and yellow, the plot resembles an avocado and hence the nickname.
The NOAA map is providing only the state boundaries, so the goal is to reproduce the tornado probabilities regions on a more detailed map.
In order to reproduce the “avocado” for the Midwest, we need the coordinates for the three polygons. These are available in a raw form from:
The NOAA map is providing only the state boundaries, so the goal is to reproduce the tornado probabilities regions on a more detailed map.
In order to reproduce the “avocado” for the Midwest, we need the coordinates for the three polygons. These are available in a raw form from:
In[]:=
raw=Import["https://www.spc.noaa.gov/products/outlook/archive/2024/KWNSPTSDY1_202407152000.txt","Data"];
In[]:=
Short[raw,32]
Out[]//Short=
{DAY 1 CONVECTIVE OUTLOOK AREAL OUTLINE,NWS STORM PREDICTION CENTER NORMAN OK,0300 PM CDT MON JUL 15 2024,,VALID TIME 152000Z - 161200Z,,PROBABILISTIC OUTLOOK POINTS DAY 1,,... TORNADO ...,,0.02 43487849 43627598 43107515 42477560 42097691 42147857, 42577917 43197885 43487849,0.02 39668553 39468674 39628959 40319412 41349490 42139493, 43089435 43819226 43928813 43168450 42398331 41248325, 40268422 39668553,0.05 42779210 43288937 43328802 42928547 42468459 41678418, 41198433 40568549 40278673 40188831 40499141 40659219, 41059318 42089336 42779210,0.10 41198514 41008606 40798804 40838892 40949024 41189112, 41479124 41919120 42169094 42568991 42658916 42698794, 42668758 42378638 42098550 41688493 41198514,&&,,... HAIL ...,98,25 ENE DNS 30 N FOD RST.,,THERE IS A MRGL RISK OF SVR TSTMS TO THE RIGHT OF A LINE FROM 20 NNW,MSS 20 NE SLK 30 NNW RUT 15 SSE LEB 20 SSE PSM 15 NNW HYA 25 SSW EWB,10 ENE BDR 15 WNW EWR 15 NNW DOV 25 SSW DCA 10 E CRW 40 SW LUK 10,SSW STL 30 W COU 30 SSE TOP 20 E HUT 45 SE DDC 10 W LBL 35 SSE LHX,15 W RWL 40 ESE RIW 35 WSW 4BQ 35 SW BHK 30 SSE BHK 25 SSW MBG 40,NNW HON 10 S VVV 30 NE AXN 50 ESE BJI 20 SSE INL 40 NNE INL.,,THERE IS A MRGL RISK OF SVR TSTMS TO THE RIGHT OF A LINE FROM 85 WSW,TUS 25 ENE PHX 60 SSW INW 10 WNW SOW 30 SSE SOW 35 NNE SAD 45 ENE,DUG 55 ESE DUG.,,GEN TSTMS ARE FCST TO THE RIGHT OF A LINE FROM 50 WSW SAN 10 E PMD,15 ESE NID 55 NNW NID 55 ESE FAT 30 E MER 45 NE SCK 60 SE RBL 25 ESE,RBL 50 ESE EKA 10 ESE ACV 15 SSE CEC 30 W MFR 65 N LMT 35 ESE BNO,BOI 60 NNW SUN 25 E BTM 25 NNE LVM 10 SW LWT 50 NE GTF 40 WSW CTB 40,NNW GPI 95 NW GPI ...CONT... 115 N OLF 40 NE ISN 40 ESE N60 30 SW,JMS 50 NNE ABR 45 S FAR 15 E DTL 35 NNW DTL 20 E GFK 35 WSW HCO 90 N,DVL ...CONT... 30 ESE GLS 20 NNE GLS 45 NW BPT 40 W POE 20 N IER 15,S ELD 15 SSE PBF 50 SSE BVX BVX 15 S HRO 20 NE MKO 25 S CQB 25 W CHK,15 S AMA 10 WSW TCC 40 NNE 4CR 35 SSW ABQ 15 WNW ONM 30 SE TCS 30 NW,ELP 10 N GDP 10 WNW INK 35 S MAF 60 NE 6R6 30 SSE DRT 80 WNW LRD.}
The coordinate strings need to be copied and edited manually:
In[]:=
tornado02=StringSplit["39668553 39468674 39628959 40319412 41349490 42139493 43089435 43819226 43928813 43168450 42398331 41248325 40268422 39668553"]
Out[]=
{39668553,39468674,39628959,40319412,41349490,42139493,43089435,43819226,43928813,43168450,42398331,41248325,40268422,39668553}
In[]:=
tornado05=StringSplit["42779210 43288937 43328802 42928547 42468459 41678418 41198433 40568549 40278673 40188831 40499141 40659219 41059318 42089336 42779210"]
Out[]=
{42779210,43288937,43328802,42928547,42468459,41678418,41198433,40568549,40278673,40188831,40499141,40659219,41059318,42089336,42779210}
In[]:=
tornado10=StringSplit["41198514 41008606 40798804 40838892 40949024 41189112 41479124 41919120 42169094 42568991 42658916 42698794 42668758 42378638 42098550 41688493 41198514"]
Out[]=
{41198514,41008606,40798804,40838892,40949024,41189112,41479124,41919120,42169094,42568991,42658916,42698794,42668758,42378638,42098550,41688493,41198514}
Each string is half latitude and half longitude with two decimal places. The longitude also needs to be converted to a negative number. Let’s create a helper function:
In[]:=
coordsToGP[st_String]:=Module[{lat,lon},lat=ToExpression[StringTake[st,4]]/100.;lon=Minus[ToExpression[StringTake[st,-4]]/100.];GeoPosition[{lat,lon}]]
Convert the data:
t10=Map[coordsToGP,tornado10];t05=Map[coordsToGP,tornado05];t02=Map[coordsToGP,tornado02];
Sanity check:
In[]:=
First[t10]
Out[]=
GeoPosition[{41.19,-85.14}]
Now let’s plot:
In[]:=
legend=SwatchLegend[{Darker@Green,Lighter@Brown,Lighter@Yellow},{"2%","5%","10%"}];
In[]:=
Legended[GeoGraphics[{Darker@Green,GeoPolygon[t02->t05],Darker@Brown,GeoPolygon[t05->t10],Yellow,GeoPolygon[t10]},PlotLabel->Style["Tornado probability within 25 miles of a location.",Bold,14]],legend]
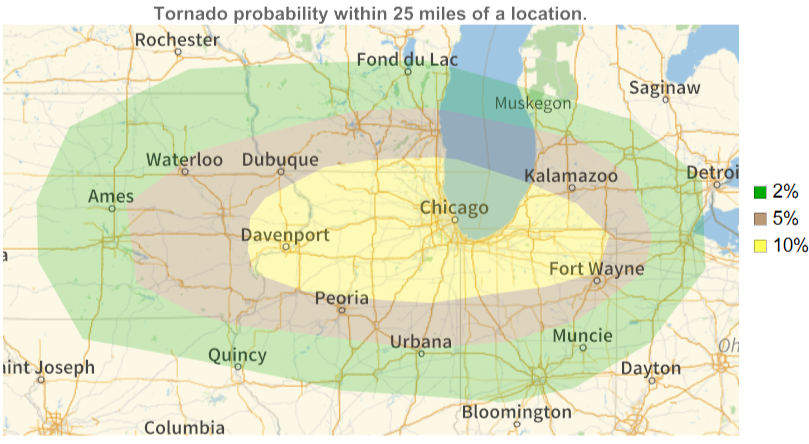
Now it is easy to see that Champaign-Urbana is almost on the edge of the 5% zone.
Interestingly, the tornado probability within 25 miles of a location defines a value of for some spatial point process - and for the yellow area it is:
proc
In[]:=
eqn[proc_]:=(EmptySpaceF[proc,Quantity[25,"Miles"]]==1/10)
Assuming uniform intensity over the region, let’s use the Poisson point process as a tornado pattern model:
In[]:=
eqn[PoissonPointProcess[λ,2]]
Out[]=
1-
λ
1
10
Find the process parameter λ:
In[]:=
sol=First@Solve[eqn[PoissonPointProcess[λ,2]],λ,Reals]
Out[]=
λ
Define the Poisson point process:
In[]:=
model=PoissonPointProcess[λ/.sol,2]
Out[]=
PoissonPointProcess,2
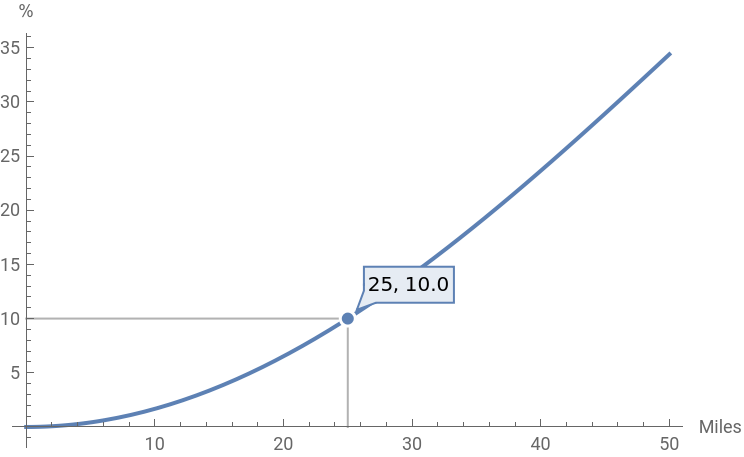
Compute probabilities of a tornado within a given radius of a location withing yellow area:
In[]:=
Plot[100*EmptySpaceF[model,Quantity[r,"Miles"]],{r,0,50},AxesLabel{"Miles","%"},PlotHighlighting->Placed["Dropline",25]]
Out[]=
CITE THIS NOTEBOOK
CITE THIS NOTEBOOK
Reproducing NOAA "avocado plot" and high tornado risk forecast for Jul 15, 2024 U.S. Midwest
by Gosia Konwerska
Wolfram Community, STAFF PICKS, July 15, 2024
https://community.wolfram.com/groups/-/m/t/3221665
by Gosia Konwerska
Wolfram Community, STAFF PICKS, July 15, 2024
https://community.wolfram.com/groups/-/m/t/3221665