Introduction
Introduction
In this project an approach to demonstrating the statistical problem solving process to teachers, teacher educators, and evaluation administrators is described. The teaching method also emphasizes the necessity for technology integration to analyze modern data along learning progressions that supports ways of fostering computational reasoning skills. Describing visible behaviours of learners in this way helps teachers feel more comfortable adapting new teaching methods in their classrooms because they know their evaluators have been properly trained on what to observe in the learning environment. At each level of proficiency, learners’ knowledge and skills can be observed and measured using various assessment tools. The guiding question for the project is whether the proposed approach constitutes an effective teaching practices in statistics and data science education.
The Framework
The Framework
The Guidelines for Assessment and Instruction in Statistics Education (GAISE) Report II (2020), describes the foundations for statistical thinking through the statistical problem solving process [Figure 1] and by describing competencies at various levels. Figure 1 diagrams the iterative process involved in conducting a statistical investigation of data is comprised of four components: 1) formulating a statistical question, 2) data consideration and collection, 3) data analysis, and 4) interpretation of results. Any component in the framework may be revisited as insights into the data arise during the investigation. An additional dimension of the process is the learning progression, defined as developmental levels A, B and C.
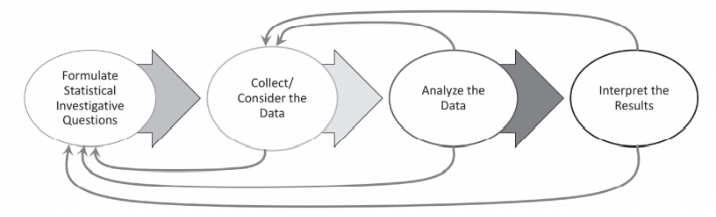
Figure 1. The Statistical Problem Solving Process retrieved from Bargagliotti, et. al., 2020
Presentation of the Activity
Presentation of the Activity
The learning activity guides the participant through a statistical investigation of data from the 2019 season of the Women’s National Basketball Association (WNBA). The rendition of the Framework Table provides the specific competencies for the process components at each level for the various tasks encountered in the activity. They have been coded for reference in the table below. Through the activity, the participant is expected to provide an appropriate response for the given process component and level (the numbered objectives in the table). Alternatively, through planning with a teacher evaluator a discussion ensues about learning expectations to be observed during the lesson for the level of the class. Either approach helps educators understand ways to implement the statistical problem solving process in the classroom.
Framework Table for the Learning Activity
Framework Table for the Learning Activity
Table 1 shows the alignment of the objectives at each level of statistical thinking development with the components of the statistical problem solving process. The learning objectives are specific to the learning activity. Versions of the table can be created around other competencies listed in the Framework Table of the GAISE II report.
Table 1. Framework Table
Table 1. Framework Table
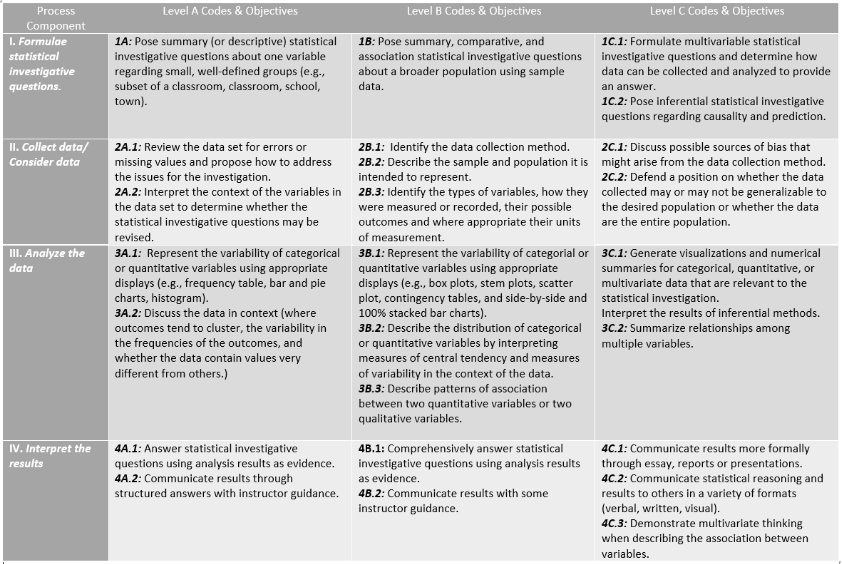
The levels in the table are not for a particular age or grade, but more about evolving a learner with simple, medial statistical thinking skills to one with advance, complex statistical thinking skills. Consider a Level A learner as one with no prior experience in statistics, and regardless of the learner's age or grade expectations of performance at Level C are highly inappropriate. The same is applicable for Level B. Data investigations are heavily teacher-guided at Level A, and taper off considerably at subsequent levels. Furthermore, a Level C learner is one who has mastered and where appropriate continues to apply knowledge and skills obtained at prior levels, but in more elaborate and innovative ways.
Snippets of the Statistical Investigation
Snippets of the Statistical Investigation
A few of the tasks from the project are presented to show applications of the Framework Table.
Example of a Task for Data Considerations and Collection
Example of a Task for Data Considerations and Collection
The data were extracted from the Basketball Reference website on July 2, 2021 and represent the statistics totals for players in the 2019 WNBA regular season. Review the Variable Glossary for the data in the following section.
Variable Glossary
Pos -- Position. Meant to reflect average career role
G -- Games
MP -- Minutes Played
GS -- Games Started
FG -- Field Goals
FGA -- Field Goal Attempts
FG% -- Field Goal Percentage
3P -- 3-Point Field Goals
3PA -- 3-Point Field Goal Attempts
3P% -- 3-Point Field Goal Percentage
2P -- 2-Point Field Goals
2PA -- 2-point Field Goal Attempts
2P% -- 2-Point Field Goal Percentage
FT -- Free Throws
FTA -- Free Throw Attempts
FT% -- Free Throw Percentage
ORB -- Offensive Rebounds
TRB -- Total Rebounds
AST -- Assists
STL -- Steals
BLK -- Blocks
TOV -- Turnovers
PF -- Personal Fouls
PTS -- Points
In the space below, describe what you would discuss about the variable glossary with a Level A learner.
Your Response:
Framework table codes: 2A.2
In the box below, describe what things you would expect a Level B student to notice about the variable glossary. You may use specific examples in your description.
Your Response:
Framework table codes: 2B.3
Pose at least two statistical questions you would expect a Level C learner to pose to investigate the data. Describe features of the question that make it Level C.
Your Response:
Framework table codes: 1C
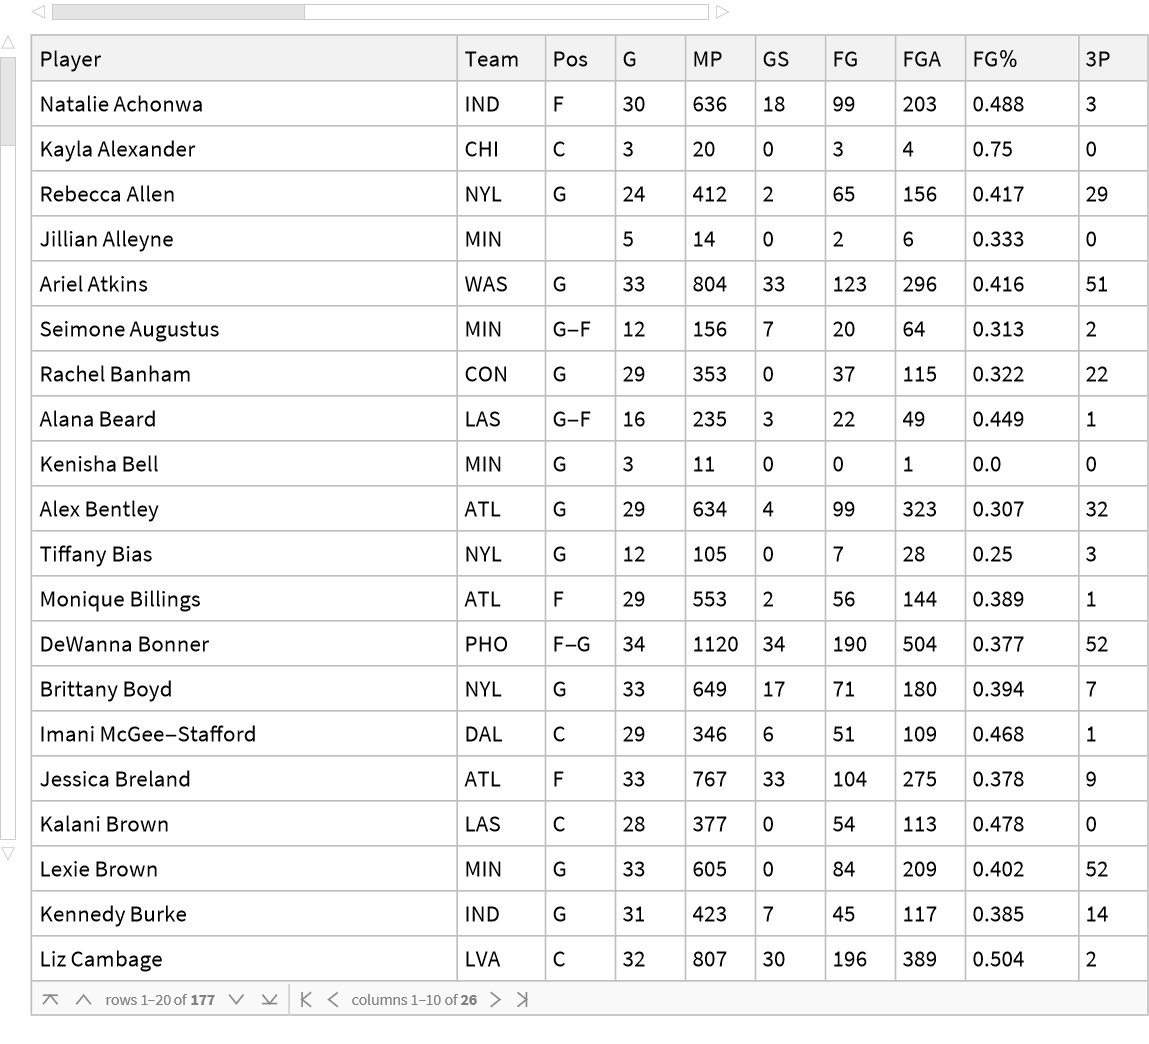
The code used to scrap the data from the website is provided below. A Level C learner would be expected to know how to obtain data from various secondary sources. Review and then run the code to see what the student extracted. View the contents of the table to ensure the data loaded as expected. The dataset has many rows, but glance through from top to bottom, and left to right to see if anything jumps out at your. A partial table is shown, so use the sliders to view more data.
In[]:=
data=Import["https://www.basketball-reference.com/wnba/years/2019_totals.html#totals","FullData"]
In[]:=
headers=data[[12,3,2,1,2,1]]
In[]:=
wnba19players=data[[12,3,2,1,3]]
In[]:=
grouped19=AssociationThread[headers->#]&/@wnba19players
In[]:=
playerDataset=Dataset[grouped19]
Out[]=
In[]:=
playerDataset
Suppose you used the data table for a lesson in which the learners were considered Level A, and consider code 2A.1 in the Framework Table. Write at least two prompts you would give the students to notice in the table.
Your Response:
Framework table codes: 2A.1
Look at the second process component in the Framework Table and identify a Level B objective you could use in a lesson. State the objective and explain your method for incorporating it into the lesson for the dataset. That is, what would you talk to students about or instruct them to due for the given dataset.
Your Response:
Framework table codes: 2B.1,2,3
Example of a Task for Analyzing the Data
Example of a Task for Analyzing the Data
The code below was used in a prior task based on further considerations for preparing the data for analysis.
In[]:=
playerDataset[Select[(Not[MemberQ[{"Team","TOT"},#Team]]&)]]
In[]:=
Join[<|"Pos"->"G"|>,DeleteMissing@"Player""Marine Johannes","Team""NYL","Pos"Missing["NotAvailable"],"G"19,"MP"345,"GS"0,"FG"48,"FGA"110,"FG%"0.436`,"3P"25,"3PA"66,"3P%"0.379`,"2P"23,"2PA"44,"2P%"0.523`,"FT"15,"FTA"19,"FT%"0.789`,"ORB"9,"TRB"34,"AST"46,"STL"8,"BLK"3,"TOV"22,"PF"30,"PTS"136]
Out[]=
PosG,PlayerMarine Johannes,TeamNYL,G19,MP345,GS0,FG48,FGA110,FG%0.436,3P25,3PA66,3P%0.379,2P23,2PA44,2P%0.523,FT15,FTA19,FT%0.789,ORB9,TRB34,AST46,STL8,BLK3,TOV22,PF30,PTS136
In[]:=
Query[Select[#Player=="Marine Johannes"&],Prepend["Pos"->"G"]/*KeyTake[Normal[Keys[playerDataset[1]]]]][playerDataset]//Normal
Out[]=
{PlayerMarine Johannes,TeamNYL,PosG,G19,MP345,GS0,FG48,FGA110,FG%0.436,3P25,3PA66,3P%0.379,2P23,2PA44,2P%0.523,FT15,FTA19,FT%0.789,ORB9,TRB34,AST46,STL8,BLK3,TOV22,PF30,PTS136}
In[]:=
activeDataset=Dataset[playerDataset[Select[#G>9&&#MP>48&]]]
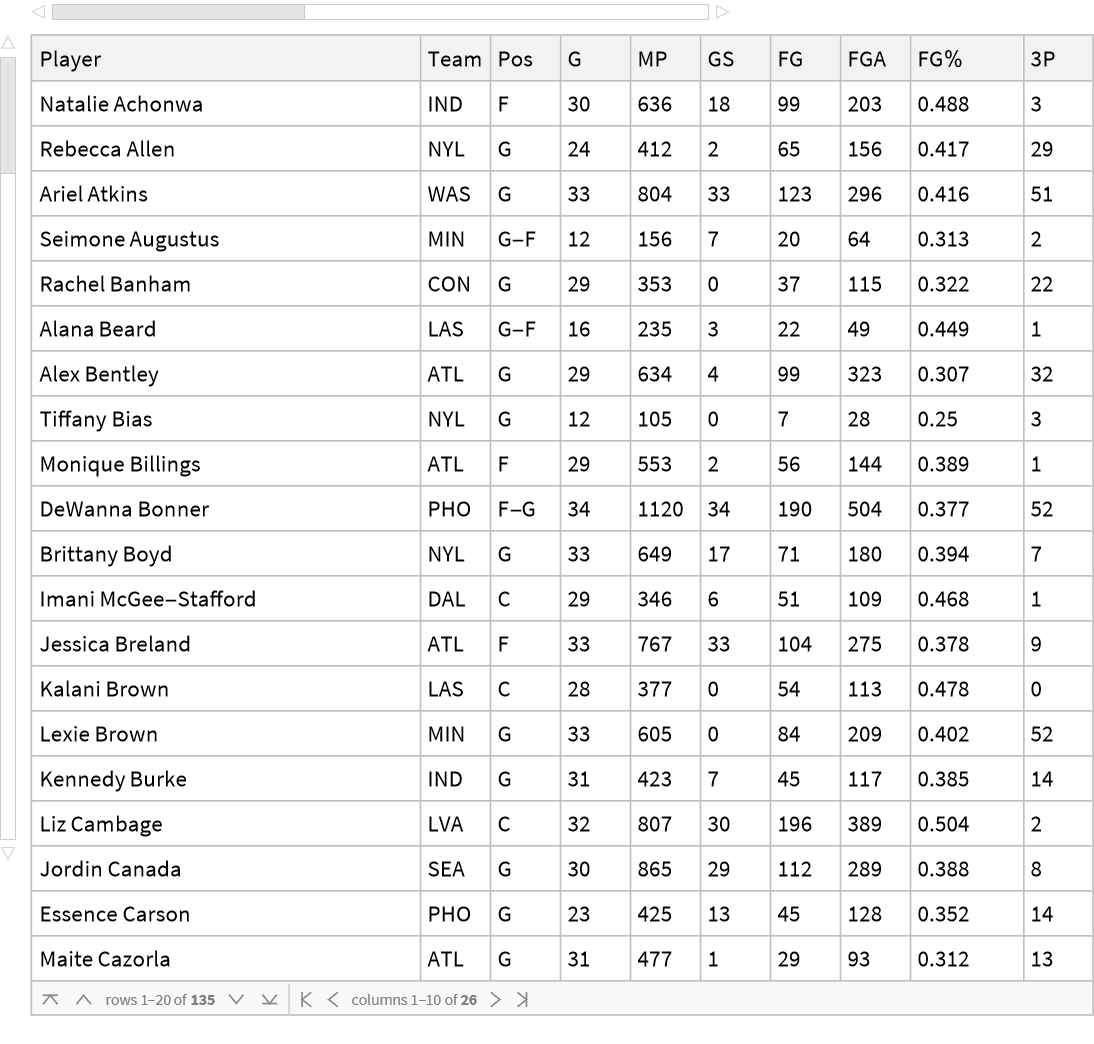
Some players were free agents at the time the data were selected. This means they were not officially on a team, so we will remove these rows for the analysis.
In[]:=
activeDataset=activeDataset[Select[(Not[MemberQ[{"TOT"},#Team]]&)]]
Out[]=
Study the lines of code below. Write a few statements describing how you would explain the code to a Level C learner. Then run the code.
Your Response:
Look over the output generated from the code. What are some exemplary statements a Level B learner would make on an item that assesses objective 3B.2 using the table?
Your Response:
Framework table codes: 3B.2
Next is the code to generate a histogram, box plot, and quantile plot.
Generate all of the visualizations for two other variables. Insert your code below.
Your Response 1:
Your Response 2:
Choose one of the histograms (preferably one that goes with the statistical question). Describe how you would guide Level A students through understanding what is expected in objective 3A.2.
Your Response:
The next code creates data sets for the frequencies of the categories for a variable and then generates the bar and pie chart.
Insert code below for another categorical variable and run it to generate the bar and pie charts.
Your Response:
Consider the statistical problem solving process for a Level A learner. What components of the process you would prompt learners to revisit based on what has been covered so far? Explain.
Your Response:
Interpret the Results (Levels A & B)
Interpret the Results (Levels A & B)
List two things you would do to guide a Level A learner through objectives 4A.1 and 4A.2.
Your Response:
Write an example of an exemplary response a Level B student would make for an item that assesses objectives 4B.1 and 4B.2.
Your Response:
Example of a Task for a Multivariate Analysis
Example of a Task for a Multivariate Analysis
A Level C student is interested in investigating how the rate at which a player attempts a 2- or 3-point field goal are associated with the total points.
Write the program you would expect the student to submit for the investigation.
Your Response:
Write an example of an exemplary response a Level C student would make for an item that assesses objectives 4C.3.
Your Response:
Conclusions and Implications
Conclusions and Implications
The recent GAISE II report provides a framework for how this might be realized. The motivation of the project was to demonstrate application of this framework at the levels of statistical thinking development through various learning activities. The presented method successfully illustrates that it is possible to design a training instrument for teachers, teacher educators and administrators for developing and observing statistical and computational thinking along a specified learning trajectory. The project represents just one possibility in the numerous renditions of the Framework table that are possible. Such instruments may be studied further for validation and effectiveness through implementation with teacher candidates or within professional learning communities, which is the intent of the researcher.
References
References
◼
Bargagliotti, A., Franklin, C., Arnold, P., Gould, R., Johnson, S., Perez, L., & Spangler, D. (2020). Pre-K-12 Guidelines for Assessment and Instruction in Statistics Education (GAISE) report II. American Statistical Association and National Council of Teachers of Mathematics. https://www.amstat.org/asa/files/pdfs/GAISE/GAISEIIPreK-12_Full.pdf :Retrieved 3/20/2021.
◼
The Basketball Reference - 2019 WNBA Players: Totals. https://www.basketball-reference.com/wnba/years/2019_totals.html#totals :Retrieved 7/2/2021.
◼
Alan Zilberman and Lindsey Ice, “Why computer occupations are behind strong STEM employment growth in the 2019–29 decade,” Beyond the Numbers: Employment & Unemployment, vol. 10, no. 1 (U.S. Bureau of Labor Statistics, January 2021), https://www.bls.gov/opub/btn/volume-10/why-computer-occupations-are-behind-strong-stem-employment-growth.htm :Retrieved 6/21/2021