Weighted Voronoi Diagrams
Weighted Voronoi Diagrams


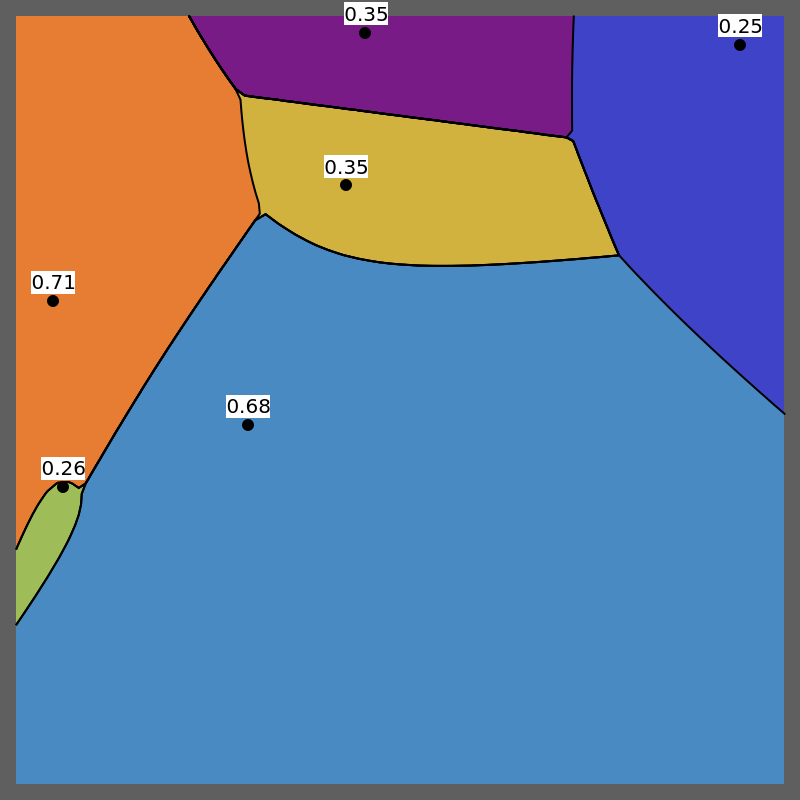
This Demonstration compares a simple Voronoi diagram with two common types of weighted Voronoi diagrams: additive and multiplicative.
In a simple Voronoi diagram, the Voronoi cell of a site is the set of all points that are closer to that site than to any other site using a distance function (Euclidean, Manhattan, chessboard, …) to measure "closeness".
A weighted Voronoi diagram uses some combination of distance and a weight associated with each site.
In an additive Voronoi diagram, the weight is subtracted from the distance. This produces hyperbolas as boundaries for the cells, as opposed to line segments in the unweighted case.
In a multiplicative Voronoi diagram, the distance is multiplied by the associated weight, which gives circular arcs as the boundaries of the cells.
If all the sites have equal weights, both the additive and multiplicative Voronoi diagrams reduce to the unweighted case.
In this Demonstration, both a site's position and associated weight are random. You can set the range of the weights with an interval slider. The weight is indicated by a label close to the position of the site in the cell.
References
References
[1] A. Dobrin. "A Review of Properties and Variations of Voronoi Diagrams." Whitman College, Senior Project Archive, 2005. (Aug 16, 2016) www.whitman.edu/Documents/Academics/Mathematics/dobrinat.pdf.
[2] R. Devulapalli. "Dynamic Data Visualization using Weighted Voronoi Diagrams." University of Minnesota. (Aug 16, 2016) www.tc.umn.edu/~devul002/internetmap.html.
External Links
External Links
Permanent Citation
Permanent Citation
Erik Mahieu
"Weighted Voronoi Diagrams"
http://demonstrations.wolfram.com/WeightedVoronoiDiagrams/
Wolfram Demonstrations Project
Published: August 17, 2016