Power Analysis for a Two-Sample t-Test
Power Analysis for a Two-Sample t-Test

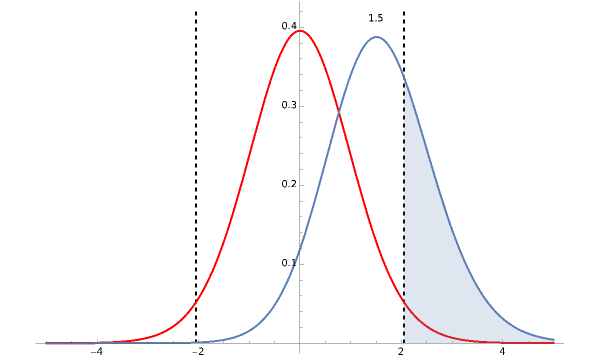
A -test examines a statistical hypothesis following a Student distribution under the null hypothesis. The object is to estimate the mean of a normal distribution for small sample size and unknown standard deviation. The -test can be used to determine if two sets of data are significantly different from one other. This Demonstration provides a visual representation for calculating power in a two-sample -test. Use the sliders to manipulate effect size, sample size and the -value to see how they affect the power in hypothesis testing. The area of the blue shaded region represents the power.
t
t
t
t
p
Details
Details
This Demonstration provides a visualization of power analysis for a two-tailed, two-sample -test. A two-sample -test is a hypothesis test to check for statistical significance between two samples. The red curve is the distribution of the null hypothesis. In a two-sample test, this is normally the control sample. The blue curve is the noncentral distribution of the alternative hypothesis. This is normally the experimental sample. The effect size and the sample size determine the noncentrality parameter . This value appears above the alternative hypothesis distribution. The two vertical lines represent the critical values. The area outside these values represents statistical significance for the given -value. Any part of the noncentral distribution outside the given values represents experiments that would be considered statistically significant. This total area is referred to as the power.
t
t
t
t
δ
t
p
t
Permanent Citation
Permanent Citation
Philip Bontrager
"Power Analysis for a Two-Sample t-Test"
http://demonstrations.wolfram.com/PowerAnalysisForATwoSampleTTest/
Wolfram Demonstrations Project
Published: March 2, 2017