Coronavirus analysis: descriptive statistics with SQL functions
by Damian Calin
by Damian Calin
The objective is to explore and play around corona data using basic descriptive statistics and SQL functions described on previous post available at
SQL operators as Wolfram Language functions
https://community.wolfram.com/groups/-/m/t/2195893
In order to load SQL functions evaluate "Main Code" cell from SQL_Operators notebook.
Any suggestions are welcomed ...
SQL operators as Wolfram Language functions
https://community.wolfram.com/groups/-/m/t/2195893
In order to load SQL functions evaluate "Main Code" cell from SQL_Operators notebook.
Any suggestions are welcomed ...
Get data
Get data
In[]:=
coronadata=ResourceData["Epidemic Data for Novel Coronavirus COVID-19","WorldCountries"];
Transform dataset into sql table
Transform dataset into sql table
(*transforminsqltypetable*)tbcoronadata=tableSQL[coronadata//Map[(#//Values)&,#]&//Normal,(*data*) coronadata[[1,All]]//Keys//Normal//ToLowerCase(*headers*) ];tbcoronadata//showTableSQL
Total Rows:222 Elapsed:1.×
-7
10
Out[]//TableForm=
Explore data
Explore data
Retrieve the data for top n most affected countries:
In[]:=
tbcoronadata//orderBySQL[#,{-deaths["LastValue"]}]&//whereSQL[#,rowNumber≤10]&//showTableSQL
Total Rows:10 Elapsed:0.0359308
Out[]//TableForm=
Plot daily deaths/confirmed cases by country
Manually select countries or retrieve country list from query
(*countries=,,,,,;*)countries=tbcoronadata//orderBySQL[#,{-deaths["LastValue"]}]&//whereSQL[#,rowNumber≤10]&//pullSQL[#,{country}]&
Out[]=
,,,,,,,,,
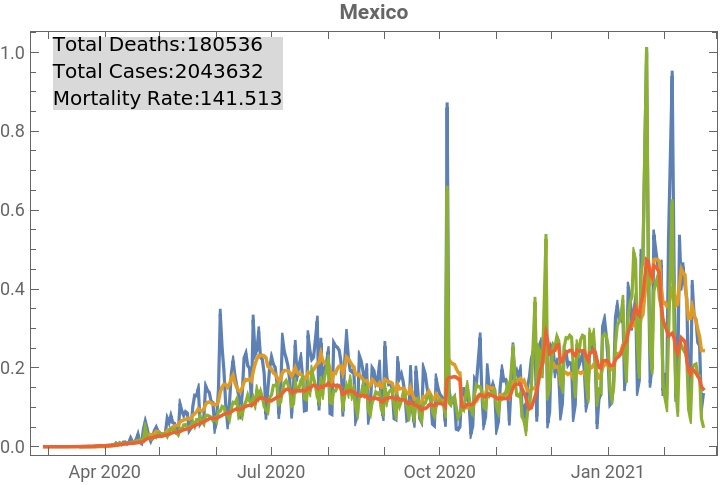
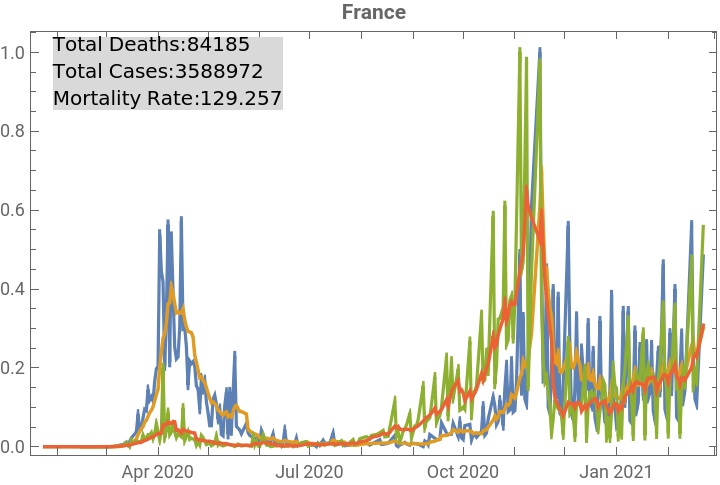
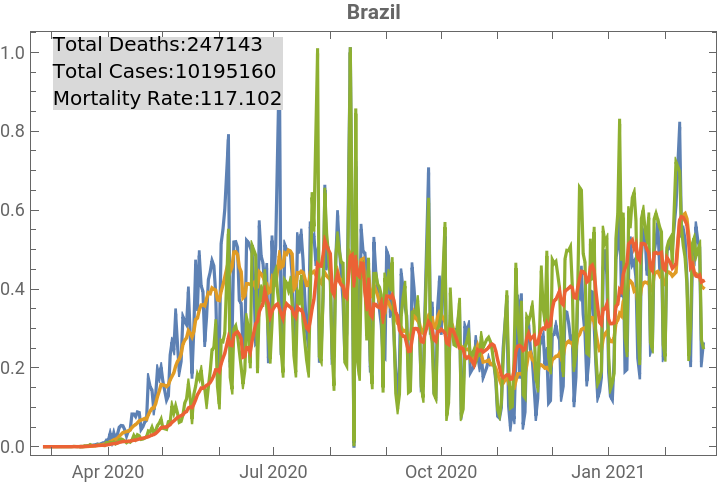
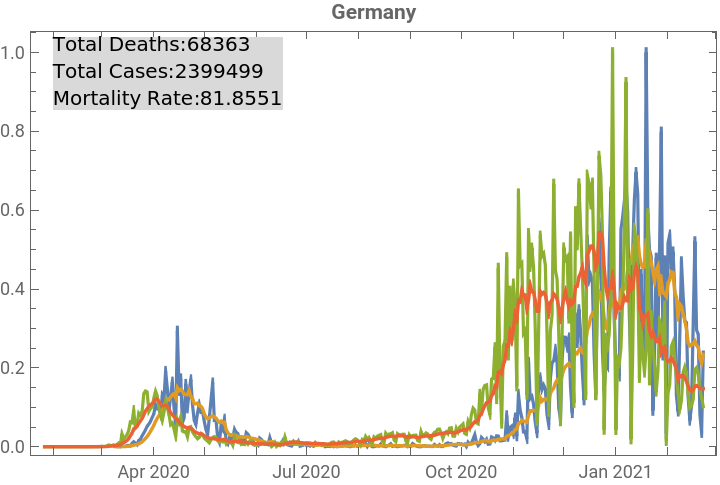
Main query to plot data
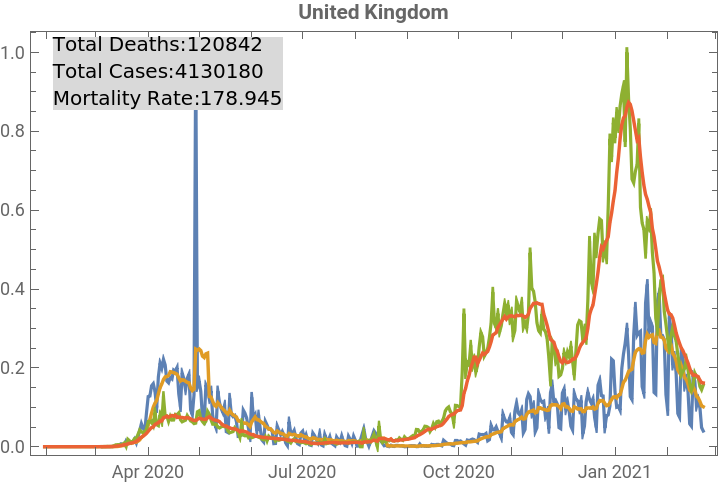
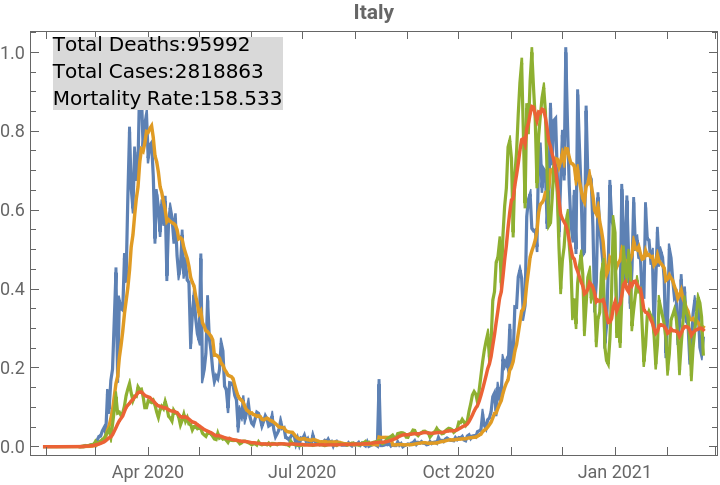
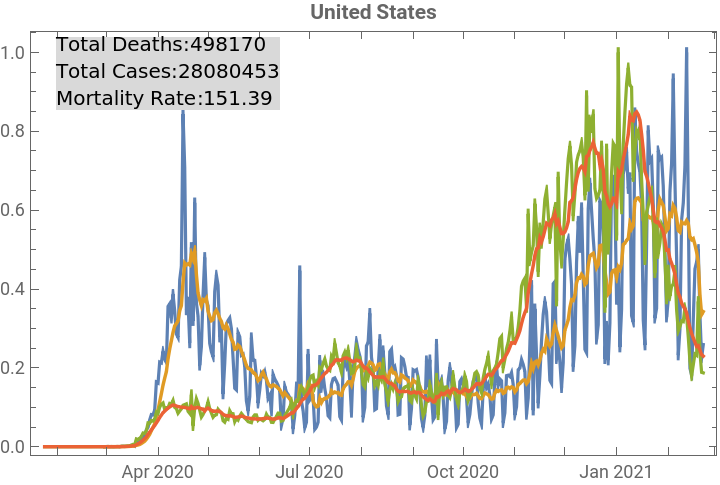
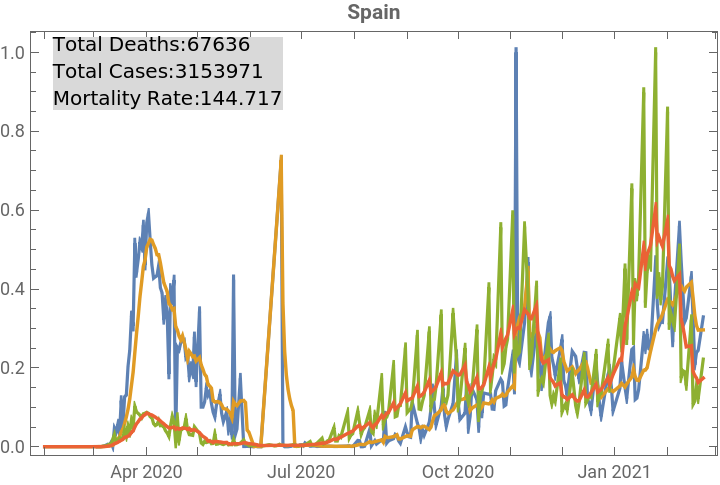
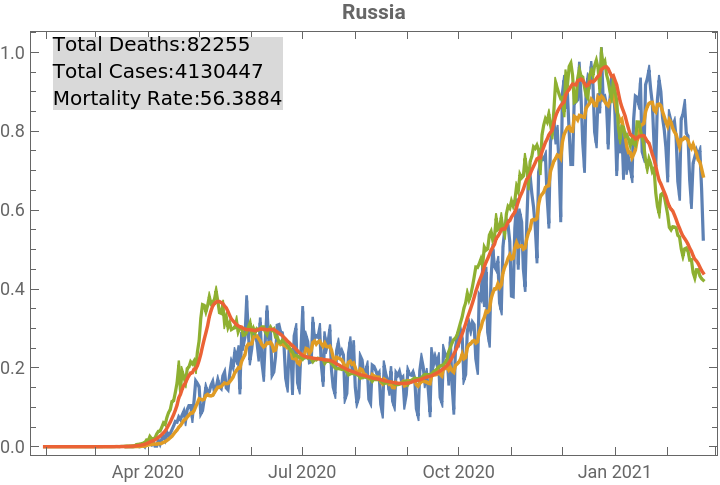
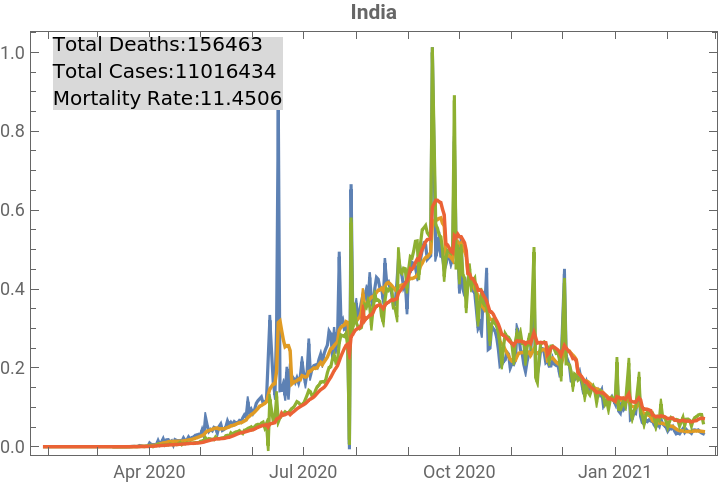
tbcoronadata//whereSQL[#,ContainsAny[{country},countries]]&//addColumnsSQL[#,Association["lastmortalityrate"deaths["LastValue"]*100000/(country["Population"]//QuantityMagnitude//N)]]&//rowTransformSQL[#,Association["country"country, "mortalityrate"lastmortalityrate, "plot"With[{diffdeaths=deaths//Differences//Normal//Cases[#,{t_,v_}/;v>0]&//TimeSeries, diffconfirmedcases=confirmedcases//Differences//Normal//Cases[#,{t_,v_}/;v>0]&//TimeSeries}, (*plot*) {diffdeaths//Rescale, MovingMap[Mean,diffdeaths//Rescale,7,None], diffconfirmedcases//Rescale, MovingMap[Mean,diffconfirmedcases//Rescale,7,None] }// DateListPlot[#,PlotRangeAll, PlotLegends(Style[#,10]&/@{"deaths","avg deaths","confirmed","avg confirmed"}), PlotStyle{Automatic,{Thickness[0.005]},Automatic,{Thickness[0.005]}}, PlotLabelStyle[country["Name"],Bold,"Helvetica"], EpilogInset[Column[Style[#,10]&/@{"Total Deaths:"<>(deaths["LastValue"]//TextString), "Total Cases:"<>(confirmedcases["LastValue"]//TextString), "Mortality Rate:"<>(lastmortalityrate//TextString)}, BackgroundRGBColor["#d9d9d9"]], Scaled[{0.2,0.9}]], ImageSizeMedium ]& ]]]&// orderBySQL[#,{-mortalityrate}]&//showTableSQL
Total Rows:10 Elapsed:1.24593
Out[]//TableForm=
country | mortalityrate | plot | ||
178.945 | ||||
158.533 | ||||
151.39 | ||||
144.717 | ||||
141.513 | ||||
129.257 | ||||
117.102 | ||||
81.8551 | ||||
56.3884 | ||||
11.4506 |


Lockdown data
Create a list of events by country and store it in sql table . I couldn’t find a structured source to import so I manually create some sample structure.
Create a list of events by country and store it in sql table . I couldn’t find a structured source to import so I manually create some sample structure.
Combine lockdown with the corona data (left join on country)
Combine corona indicators plots with events time plots
Multiple countries on same plot
Plot mortality rate evolution and compare to known mortality rates
https://en.wikipedia.org/wiki/Mortality_rate
Plot mortality rate evolution and compare to known mortality rates
https://en.wikipedia.org/wiki/Mortality_rate
Correlation between various properties
GDP vs mortality rate
GDP vs mortality rate
Generalisation of previous example using a list of country properties and plotting corresponding correlation with mortality rate
It would be interested to correlate lockdown data to mortality rate in order to check lockdown efficiency
Example comparing hard lockdown France with light lockdown Sweden
Example comparing hard lockdown France with light lockdown Sweden