Improved Supply and Demand Curves
Improved Supply and Demand Curves
Ordinary supply and demand graphs that I was taught in school involve two linear forces and their intersection.
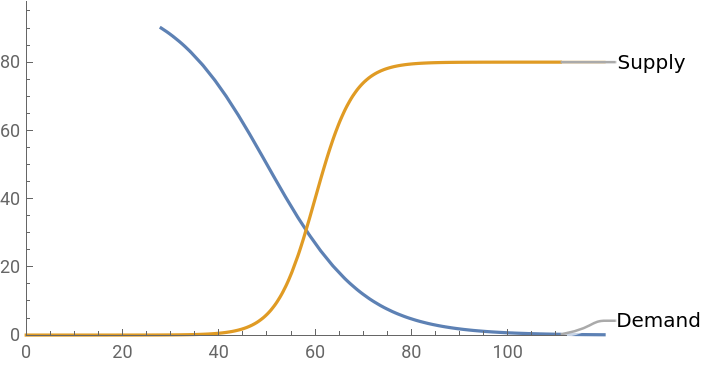
This more detailed supply and demand graph incorporates the concept of saturation.
In this model, supply & demand have limits and non-linear rates of change.
This more detailed supply and demand graph incorporates the concept of saturation.
In this model, supply & demand have limits and non-linear rates of change.
In[]:=
(*Definefunctionsfordemandandsupply*)demand[maxDemand_,rateChangeDemand_,price_,priceAtHalfMaxDemand_]:=maxDemand/(1+Exp[-rateChangeDemand*(price-priceAtHalfMaxDemand)]);supply[maxSupply_,rateChangeSupply_,price_,priceAtHalfMaxSupply_]:=maxSupply/(1+Exp[-rateChangeSupply*(price-priceAtHalfMaxSupply)]);(*Setparametervalues(adjusttheseasneeded)*)maxDemand=100;rateChangeDemand=-0.1;priceAtHalfMaxDemand=50;maxSupply=80;rateChangeSupply=.25;priceAtHalfMaxSupply=60;(*Definepricerangeforthegraph*)priceRange={0,120};(*Generatedemandandsupplydatapoints*)demandPoints=Table[{price,demand[maxDemand,rateChangeDemand,price,priceAtHalfMaxDemand]},{price,priceRange[[1]],priceRange[[2]]}];supplyPoints=Table[{price,supply[maxSupply,rateChangeSupply,price,priceAtHalfMaxSupply]},{price,priceRange[[1]],priceRange[[2]]}];(*Createtheplot*)plot=Plot[{demand[maxDemand,rateChangeDemand,price,priceAtHalfMaxDemand],supply[maxSupply,rateChangeSupply,price,priceAtHalfMaxSupply]},{price,priceRange[[1]],priceRange[[2]]},PlotRange->{{0,maxDemand+10},{0,maxSupply+10}},PlotLabels->{"Demand","Supply"}];Show[plot]
Out[]=
In[]:=
(*Definefunctionfordifferencebetweendemandandsupply*)Difference[price_]:=demand[maxDemand,rateChangeDemand,price,priceAtHalfMaxDemand]-supply[maxSupply,rateChangeSupply,price,priceAtHalfMaxSupply];(*FindtheequilibriumpriceusingFindRoot*)equilibriumPrice=FindRoot[Difference,{price,60}](*Initialguessaround60*)(*Printtheequilibriumprice*)Print["Equilibrium price:",equilibriumPrice[[1,1]]]demand[maxDemand,rateChangeDemand,price,priceAtHalfMaxDemand]-supply[maxSupply,rateChangeSupply,price,priceAtHalfMaxSupply]

Out[]=
FindRoot[Difference,{price,60}]
Equilibrium price:FindRoot[Difference,{price,60}]〚1,1〛
Out[]=
-+
80
1+
-0.25(-60+price)
100Null
1+
0.1(-50+price)
In[]:=
Solve-+==0,price,Reals
80
1+
-0.25`(-60+price)
100
1+
0.1`(-50+price)
Out[]=
{{price58.1167}}