In[]:=
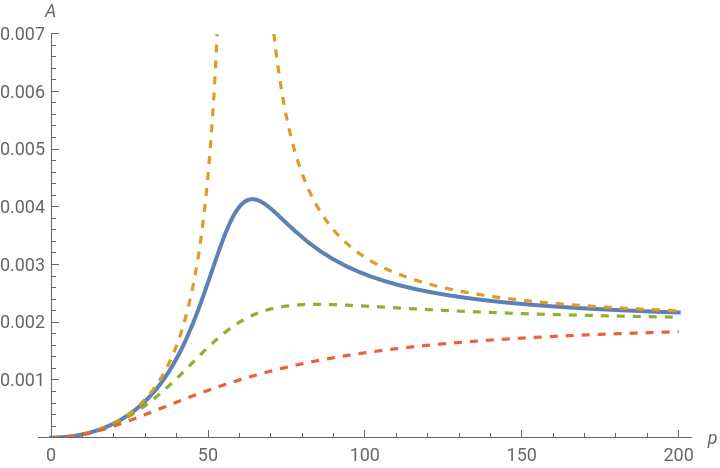
l=0.1;sigma=0.006;B=0.01;k=60;h=;m=0.1;l=0.1;=*sigma;n=2;a=;=;=;=;=;Plot[{,,,},{p,0,200},PlotStyle{{Thick},{Dashed},{Dashed},{Dashed}},AxesLabel{p,A},PlotRange{0,0.007},PlotLegendsLineLegend[{n=15,n=0,n=30,n=60}]]
m*l*
E
0
2*a
E
0
2
9
B
a
m*
2
l
3
A
max
l*h
Sqrt-1+4*
2
2
k
p
2
n
p
A
n0
l*h
Sqrt-1+4*
2
2
k
p
2
0
p
A
n2
l*h
Sqrt-1+4*
2
2
k
p
2
30
p
A
n3
l*h
Sqrt-1+4*
2
2
k
p
2
60
p
A
max
A
n0
A
n2
A
n3
Out[]=