The Erdős unit distance problem asks for the largest possible number u(n) of unit distances among n points in the plane. This is equivalent to finding maximally dense unit-distance graphs.
A recent OpenAI announcement concerns the asymptotic problem: the old n^(1+o(1)) expectation is false.
A recent OpenAI announcement concerns the asymptotic problem: the old n^(1+o(1)) expectation is false.
In the Erdős formulation, he based his conjecture on the growing density of unit graphs from a square grid.
In[]:=
units=Select[Tuples[Tuples[Range[8]/5,{2}],{2}],RootReduce[EuclideanDistance@@#]==1&];Graphics[Line/@units];GraphData[{"Fiveleaper",{8,8}}]
Out[]=
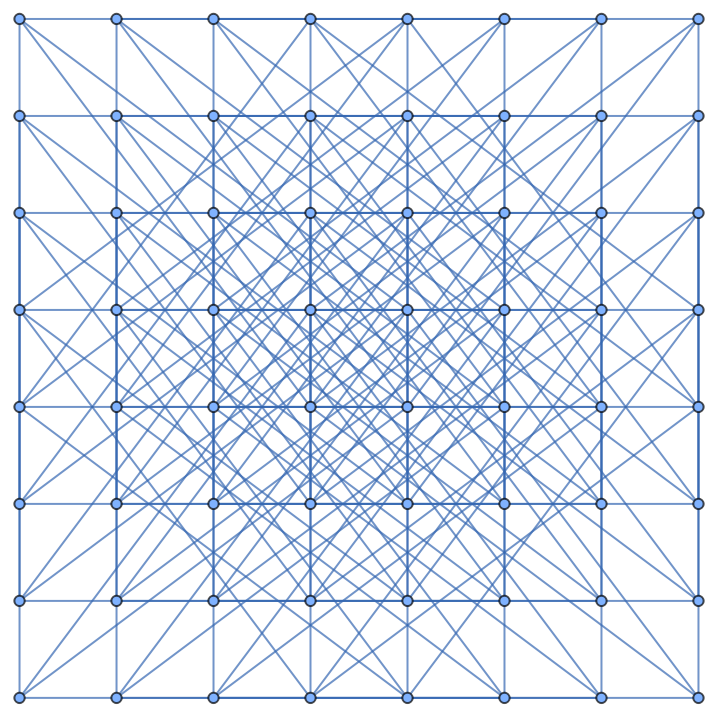
The above is based on 25 being the sum of 2 squares in more than 1 way.
In[]:=
PowersRepresentations[25,2,2]
Out[]=
{{0,5},{3,4}}
Amazingly, this graph, the five-leaper-8 graph, is a quartic graph. If we go to higher values, we can get to denser numbers of diagonals (OEIS A000446).
In[]:=
PowersRepresentations[325,2,2]
Out[]=
{{1,18},{6,17},{10,15}}
In[]:=
PowersRepresentations[1105,2,2]
Out[]=
{{4,33},{9,32},{12,31},{23,24}}
In[]:=
PowersRepresentations[27625,2,2]
Out[]=
{{20,165},{27,164},{45,160},{60,155},{83,144},{88,141},{101,132},{115,120}}
However, in maximally dense unit-distance graphs, we weren’t seeing any signs of going towards square grids. Instead, weirder graphs based on algebraic constructions predominate.
In[]:=
Row[Table[GraphData[{"MaximallyDenseUnitDistance",{21,k}}],{k,1,5}]]
Out[]=
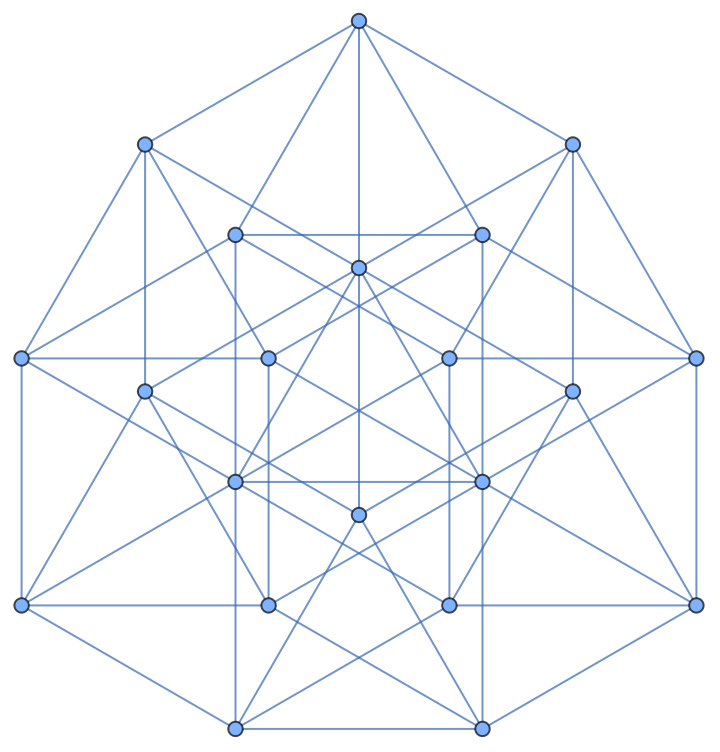
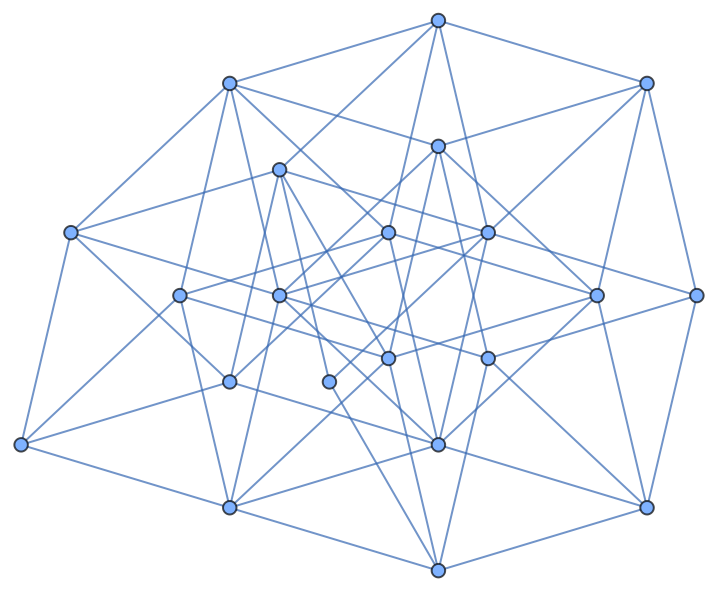
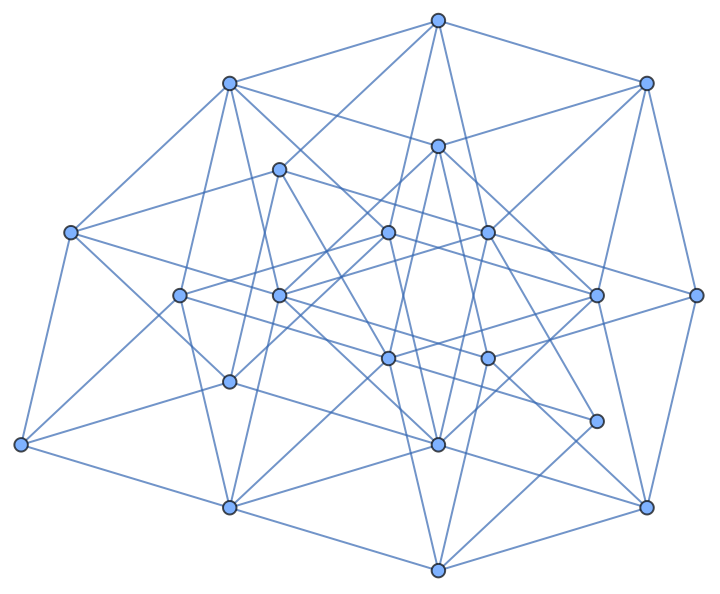
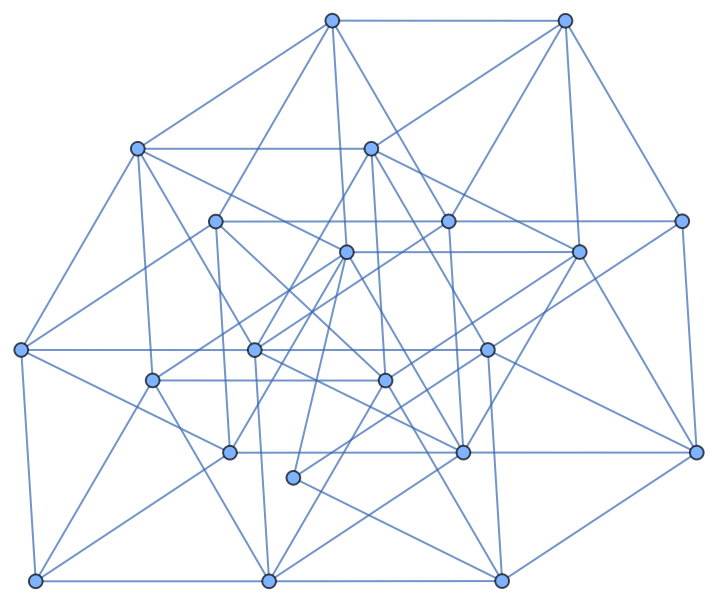
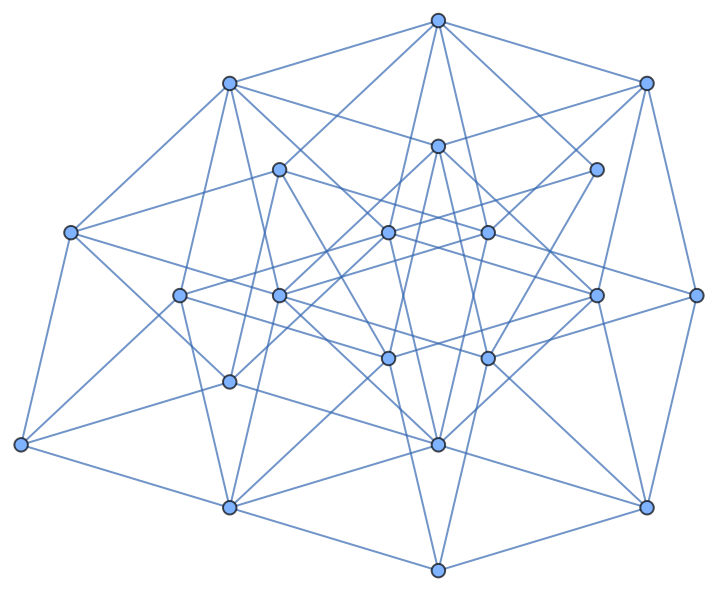
A characterization of the OpenAI paper could be “algebraic constructions win”.
So what is an algebraic construction? Here’s one based on unit stars 7|1, 7|2 and 7|3. They interlock together perfectly.
In[]:=
GraphData[{"BracedHeptagon",{42,1}}]
Out[]=
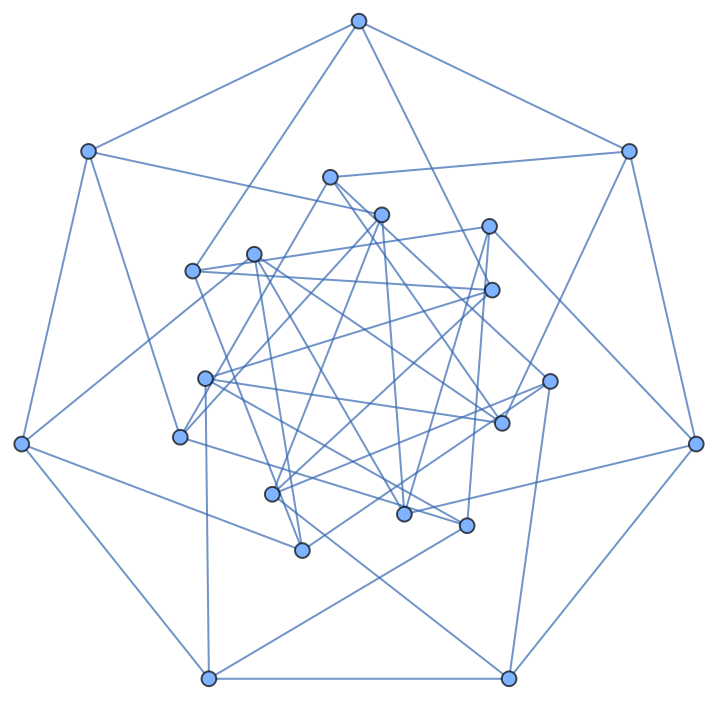
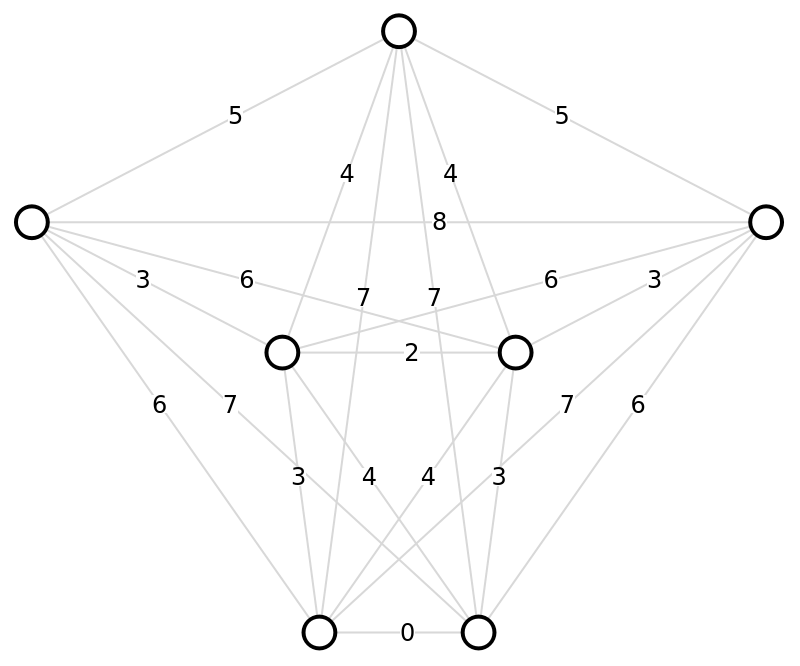
Here’s a stranger construction based on the supergolden ratio, the real root of =+1, ψ=1.46557... . All the numbers here are distances, and represent powers of . The horizontal lines are distances , and . So this is a K7 complete graph given as set of points, no three on a line, and with all distances being integer powers of the same constant. Can that be done with 8 points? I call this the supergolden diamond, by the way.
3
ψ
2
ψ
1/2
ψ
0
ψ
1
ψ
4
ψ
Out[]=
Anyways, the possibilities of algebraic grids are barely explored. The maximal graphs for 18 points come from a convergence of two different sets of algebraics.
In[]:=
Grid[Partition[Table[GraphData[{"MaximallyDenseUnitDistance",{18,k}}],{k,1,16}],4]]
Out[]=
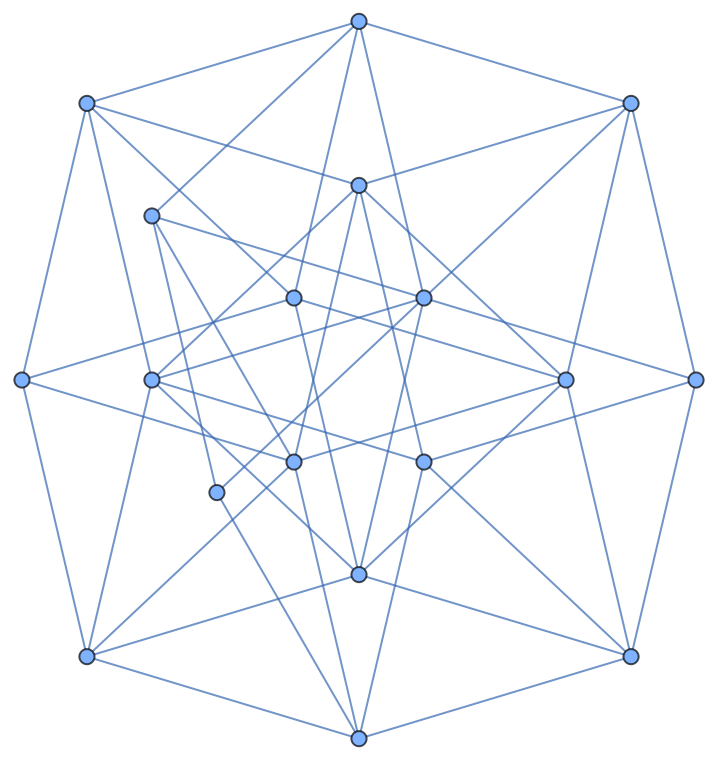
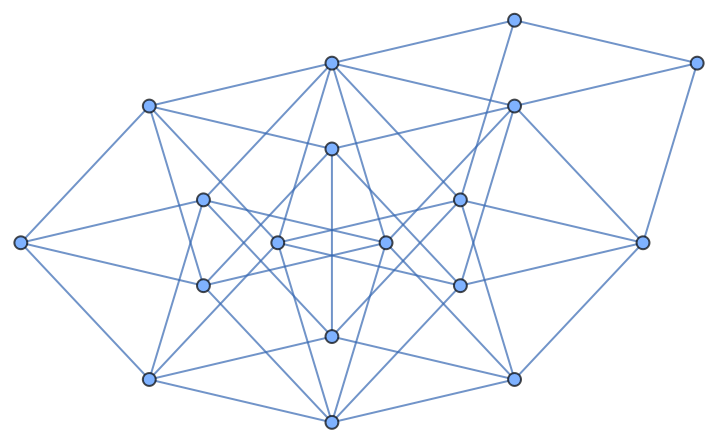
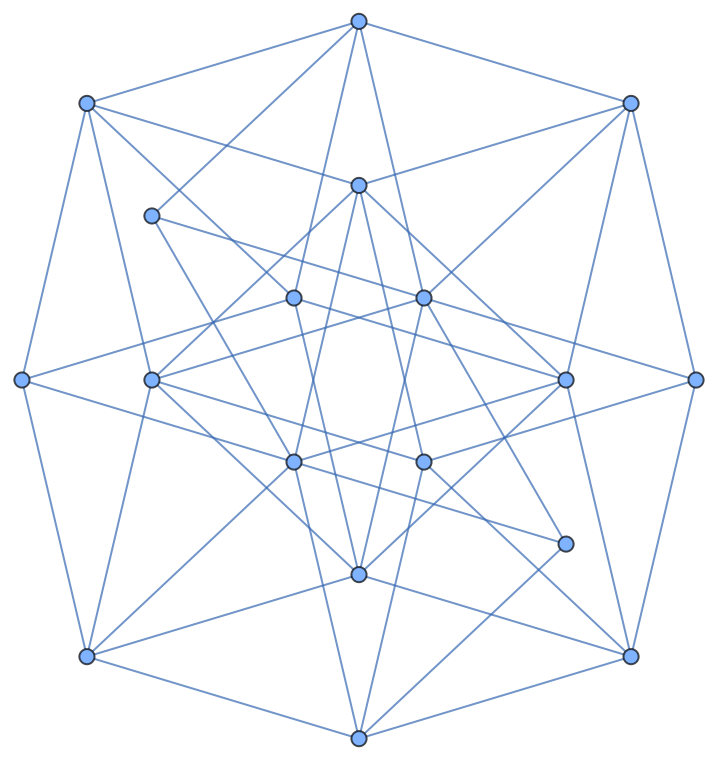
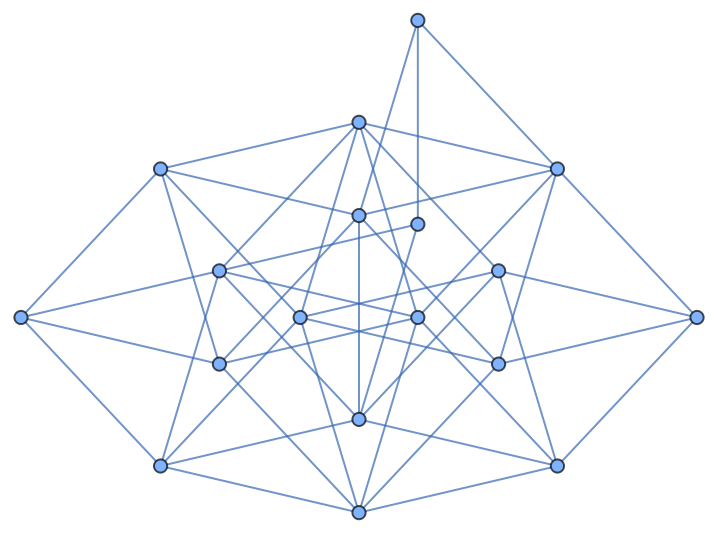
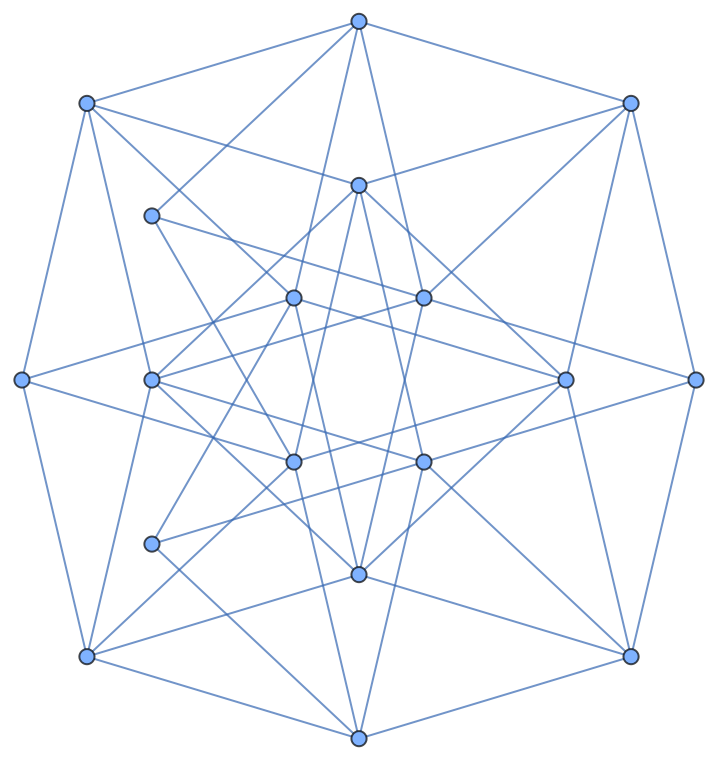
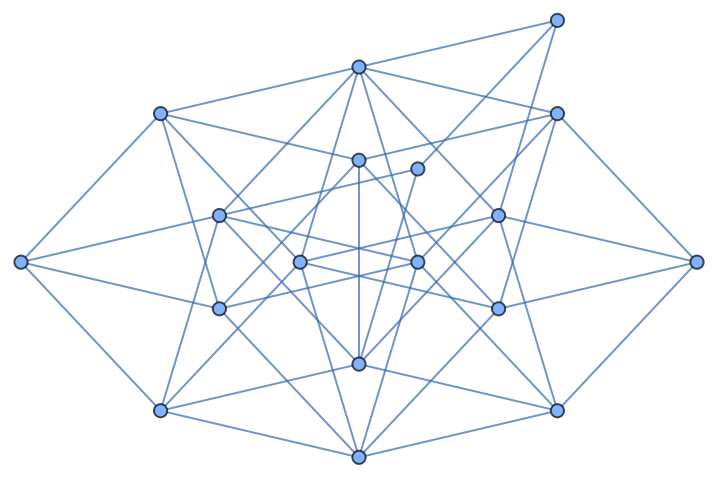
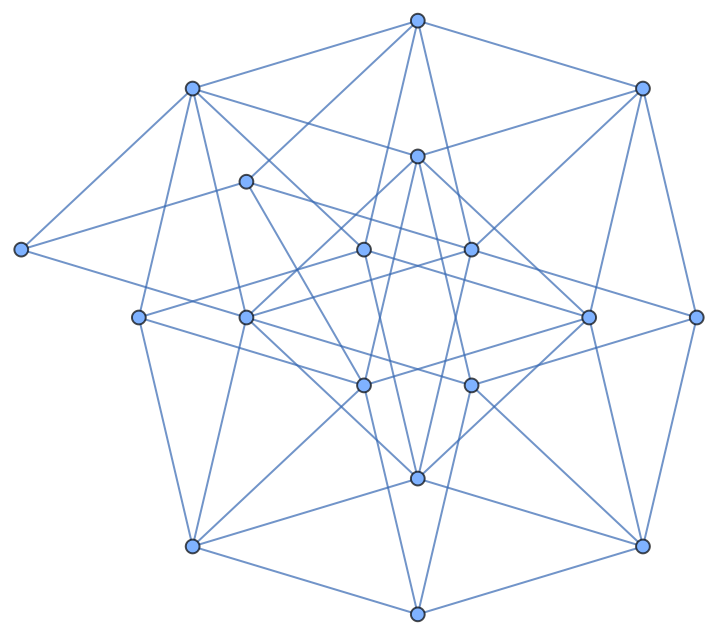
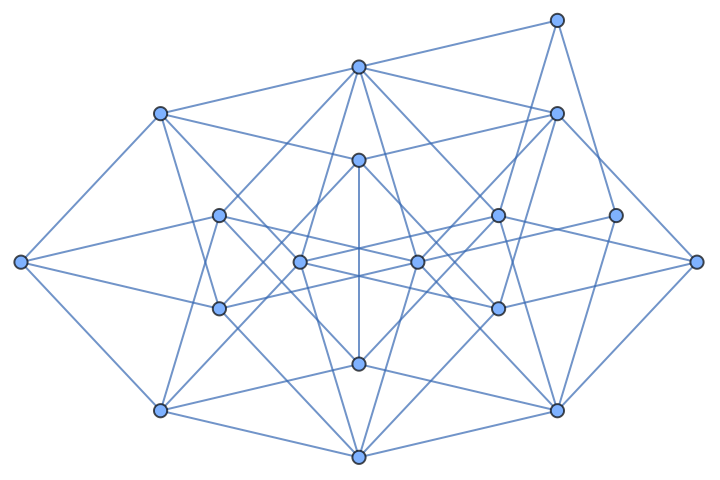
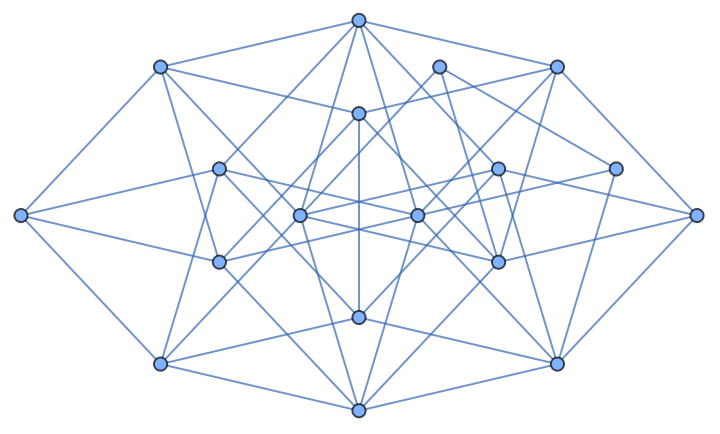
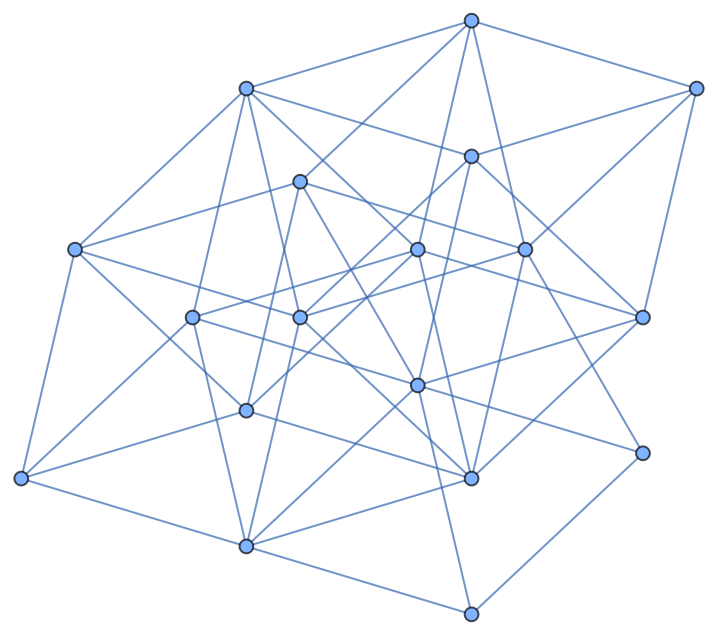
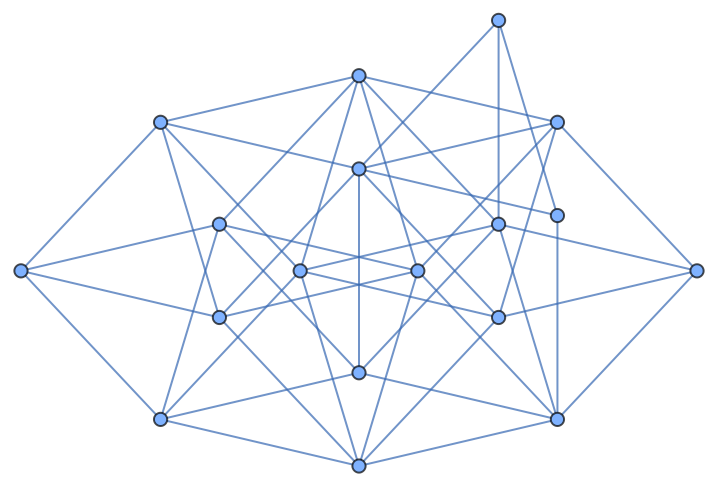
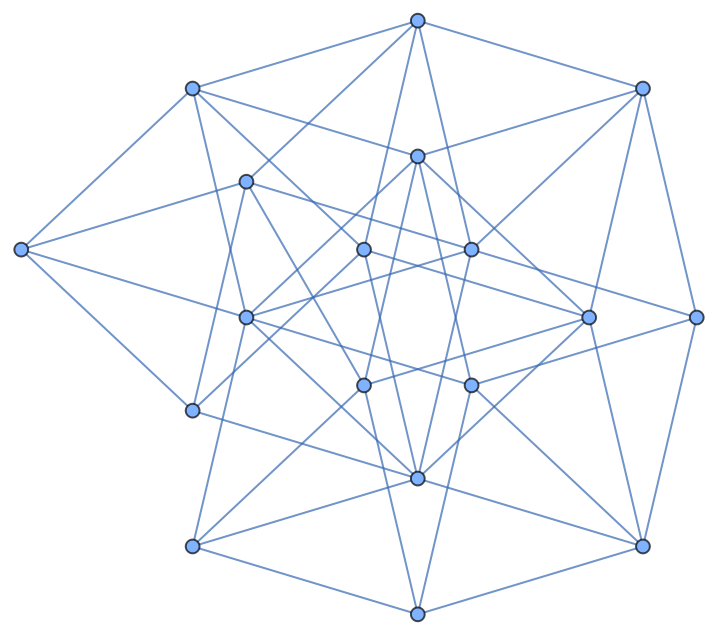
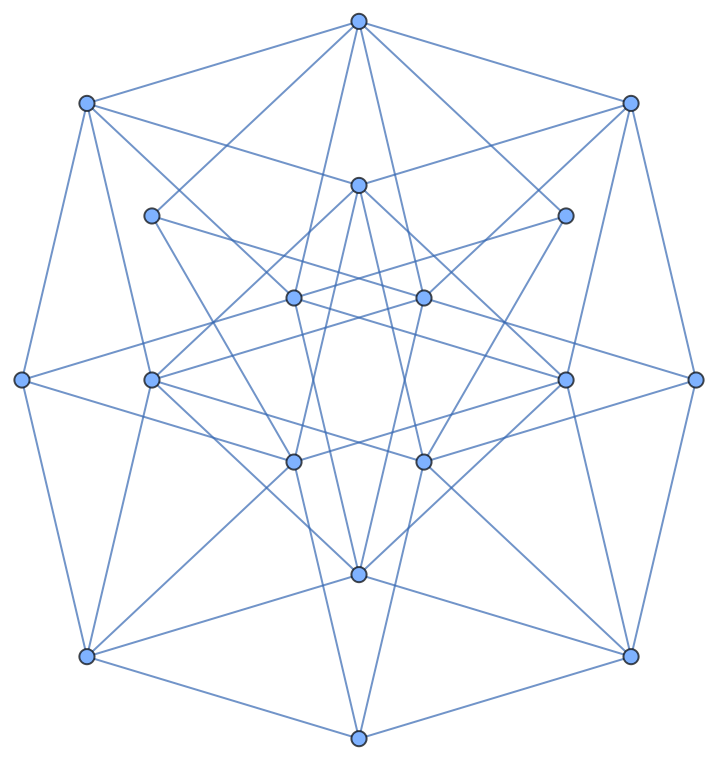
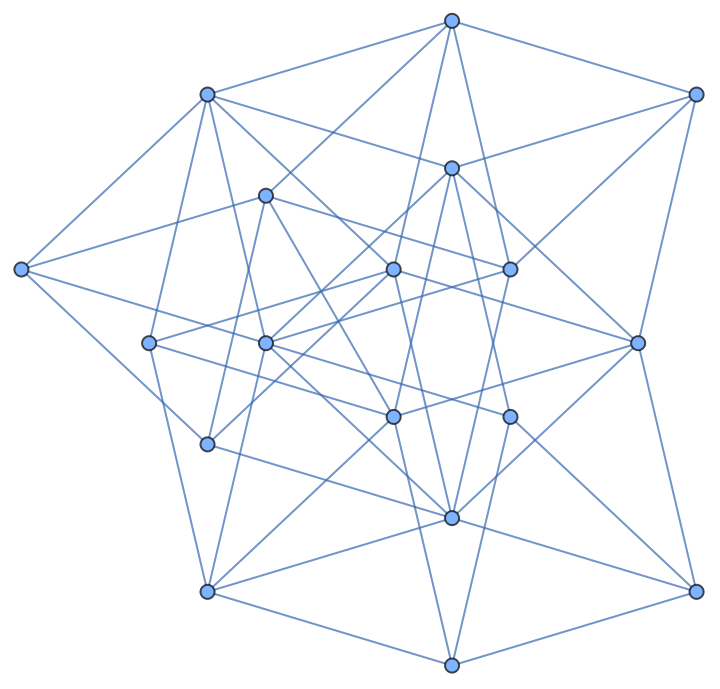
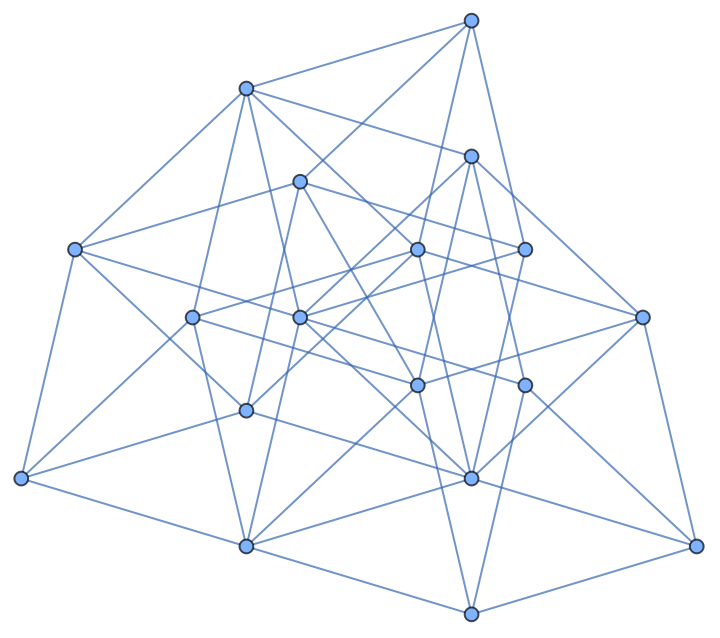
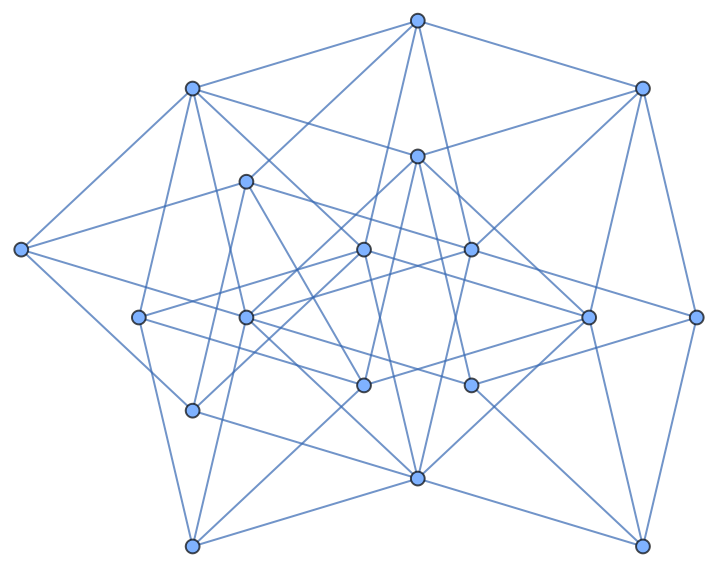
But with 2 more points, they converge to a single graph. With one more point, new things start happening (seen at the top), and things get weird enough that the best way to add another point is still unresolved.
In[]:=
GraphData[{"MaximallyDenseUnitDistance",{20,1}}]
Out[]=
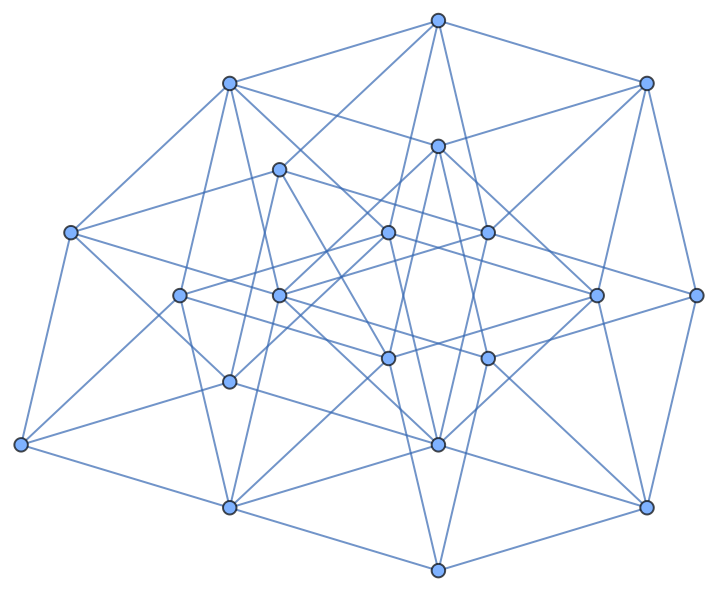
The OpenAI paper relies on ideas connected to Ellenberg–Venkatesh, Golod–Shafarevich and Hajir–Maire–Ramakrishna.
I’ll make a bold new conjecture here: The maximally dense unit-distance graph will never be based on a square grid, for any n.
Here’s a good picture for how extremal unit-distance graphs get weird: the 510-vertex Heule graph. This graph omits many points that might have been included, because they weren’t necessary for solving a different problem, the Hadwiger-Nelson Problem.
Related to these are the Parts graphs. I mention all sorts of these strange graphs at my talk, Unit-distance graphs.
Here’s another take on it. For the five-leaper, we can calculate edges/vertices density.
We can also make it as a formula. As values increase, the density approaches 6.
Here are the graphs with density 5 and over.
For graphs we have compiled in GraphData, this one is maximal.
We can use 27625 to make a denser graph.
But 43681 vertices are needed. The larger Hamming graphs will beat that. We haven’t compiled them due to inconvenient largeness.
CITE THIS NOTEBOOK
CITE THIS NOTEBOOK
OpenAI disproves Erdős unit distance conjecture
by Ed Pegg
Wolfram Community, STAFF PICKS, May 21, 2026
https://community.wolfram.com/groups/-/m/t/3719376
by Ed Pegg
Wolfram Community, STAFF PICKS, May 21, 2026
https://community.wolfram.com/groups/-/m/t/3719376