ORIGINAL BOOK: Jonathan Kinlay, Equity Analytics: Strategies, Models and Techniques in Computational Finance.
ISBN: 9798394997969. https://equityanalytics.store/
ISBN: 9798394997969. https://equityanalytics.store/
First published: 2023
Copyright © Jonathan Kinlay. All rights reserved.
No part of this publication may be reproduced or transmitted in any form or by any means, electronic or mechanical, including photocopy, recording, or any information storage and retrieval system, without permission in writing of the author.
ISBN : 9798394997969
Legal Disclaimer
Legal Disclaimer
Table of Contents
Table of Contents
Who this Book is For
Who this Book is For
Equity Analytics is a versatile resource designed with two primary audiences in mind:
◼
As a textbook for graduate - level courses in quantitative analysis, typically found in Masters or PhD programs in computational finance.
◼
As a guidebook for practitioners in hedge funds, investment management firms, research firms, and consultancy firms that focus on researching, developing or validating quantitative trading and investment strategies.
The book covers essential theories such as continuous - time models and modern portfolio theory, which form part of the core knowledge for professional quants. Additionally, it delves into current practices in quantitative finance, discussing topics like pairs trading, cross - sectional strategies, and other methodologies currently in use on Wall Street.
Equity Analytics goes beyond conventional books by offering an integrated framework for conducting empirical research. It includes not only algorithms but also a comprehensive, curated dataset of high - quality, computable equities data. This dataset, known as the Equities Entity Store, can be immediately applied for understanding the book' s material and conducting ongoing research.
The Equities Entity Store is designed to accelerate the reader' s progress in mastering the topic and pursuing live research. Users can build on the core algorithms within the store and leverage the Wolfram Language' s powerful capabilities in time series analysis, anomaly detection, and machine learning to develop proprietary trading and investment strategies. Key benefits of the Equity Entity Store include:
◼
Regular monthly updates via a subscription service.
◼
Easy extension to other markets, such as non - US equities, futures, or foreign exchange.
◼
Seamless integration of alternative data, such as sentiment data or synthetic market data.
◼
Scalability for virtually unlimited distributed computational power through Amazon AWS.
◼
Automatic access to new analytical capabilities with each Wolfram Language release, including integration with large language models like ChatGPT through a Wolfram Language Plug - In, currently under development.
In summary, Equity Analytics serves as a comprehensive resource for both academics and practitioners, providing a unique combination of essential theory and cutting - edge practice in quantitative finance. The Equities Entity Store framework empowers users to harness the full potential of the Wolfram Language and its ongoing advancements, creating a powerful tool for research and strategy development.
I hope that Equity Analytics and the Equities Entity Store will prove to be an invaluable asset to you in your future endeavours in the field of quantitative finance.
Jonathan Kinlay
May, 2023
May, 2023
Part I: The Equities Entity Store
Part I: The Equities Entity Store
1.1 Introduction to Equity Analytics
1.1 Introduction to Equity Analytics
Equity Analytics is a term not much in use currently, with practitioners giving preference to the label Equity Research to describe their research activities. But usually what is meant by Equity Research is a sell-side driven process, which can be described as follows:
Equity research is the process of analyzing and evaluating the financial performance and potential of a publicly traded company in order to make investment decisions. Equity researchers typically work for investment banks, mutual funds, or other financial institutions, and they use a variety of tools and techniques to analyze a company' s financial statements, management team, industry trends, and other factors in order to determine its intrinsic value and future growth prospects. The research is used to make buy, hold, or sell recommendations on the company' s stock.
Equity Analytics, on the other hand, describes a rather different process:
Equity analytics is the process of using quantitative and statistical techniques to analyze and evaluate the financial performance and potential of publicly traded companies. This can include analyzing financial statements, market data, and other information to identify patterns, trends, and relationships that can be used to make investment decisions. Equity analytics can also include using financial models and other tools to forecast a company' s future performance and estimate its intrinsic value. Equity analytics is often used by investment banks, hedge funds, and other financial institutions as part of their equity research process.
So the main distinctions between Equity Research and Equity Analytics are as follows:
◼
Equity Research is primarily produced by the sell-side. Equity Analytics is a research process that both the buy-side and sell-side are engaged in.
◼
The principal focus in Equity Research is the analysis of financial statements. Equity Analytics is more general in its approach and in additional to financial information may make use of market, technical, sentiment, or other non-standard data in the research process and will apply a wide range of quantitative and statistical techniques to analyze that data.
◼
Equity Research is geared to producing buy, sell and hold recommendations that are consumed by equity investors and portfolio managers who typically have a long-term investment horizon. Equity Analytics provides research output that often serves as an input to, or the basis for, a relatively short-term trading strategy.
◼
Equity Research is carried out by analysts with a background in accounting and finance. Equity Analytics is carried out by quants.
Although I have been through the necessary training to become an equity researcher my main interest has always been in quantitative research. From the start of my career in the early 1980’s, long before the advent of high frequency trading, or even pairs trading and other, now-routine, quant-driven strategies, I was fascinated by the potential of computers to produce actionable intelligence that could be used to trade the market. I coded simple forex trading systems in Assembler on one of the first commercially available micro-computers and distributed them to f/x trading desks around the bank, as well as to customer dealing rooms. In the early 2000’s I founded and served as General Partner of one of the first volatility arbitrage funds which used highly complex econometric and option pricing models to trade long/short volatility portfolios. Anticipating the potential of what are now referred to as machine learning algorithms, I founded a quant-driven equity long/short fund in the mid-2000s that deployed a large, parallelized computer network to process vast amounts of stock data using genetic algorithms. Finally, in the prop trading firm that I founded in 2009 and ran for more than a decade, we applied a mix of quantitative and econometric models and, later on, a variety of machine learning algorithms, in our high frequency trading strategies.
All this is to say that my background as a quant naturally guides me in the direction of Equity Analytics, rather than Equity Research. That doesn’t mean that I hold the latter in low regard - on the contrary, many professionals in that field carry out research of the highest caliber. But for me, the (almost exclusive) focus on financial statements and associated accounting performance analysis was always too restrictive. In my view, the identification of potential sources of alpha is a task so challenging that the analyst should be open to using any and all potentially useful data and analytical techniques that might be of assistance. This makes the role of the quant engaged in Equity Analytics more demanding (and interesting) than that of the typical equity analyst. It is not enough to be able to read and analyze financial statements - these days a successful quant has to be a reasonably accomplished programmer, and in addition possess an analytical toolkit comprising techniques derived from mathematics, statistics, economics, finance and engineering. And now that, after several false starts, AI is finally becoming a genuinely useful tool in the research arsenal, it is quants, not equity analysts, who are leading the charge in identifying its applications in financial research.
Accumulating all this know-how is just the starting point, however - an aspiring quant has to be capable of applying his knowledge “in the rough”, often relying on sets of raw data that require considerable amounts of pre-processing before they can be used for analysis. Some of these data sets can be very large, either because the span of the data is so great (covering thousands of securities, for example) or because the data is high frequency, or both. The process of acquiring, processing and managing data has now become so complex that it has evolved into a distinct functional speciality: Data Science. The problem for the quant is that, while the juice ultimately lies in the analysis of the data, it first has to be rendered fit for consumption and this first task - the data science part - can easily occupy 80% of his research bandwidth. This can lead to a considerable mis-allocation of expensive human resources, to say nothing of the frustration of highly skilled quants who find a significant proportion of their time absorbed by routine data-science drudgery instead of the more interesting analytical work they have been trained to do. Data Science is important and interesting, but nowhere near as important and interesting as the process of equity analytics, which is how the alpha is identified and expressed.
One way to address this problem is to separate out the tasks involved in data acquisition, processing and management from the process of research and analysis and indeed many larger shops do exactly this, recruiting dedicated data scientists to handle data-related issues. But that is an expensive solution, one unavailable to many smaller firms and, besides, it can result in a mismatch between the data requirements and priorities of the analyst and the understanding of those requirements and priorities by the data scientist. It’s a further link in an already long and complicated chain from idea generation, through research and development to strategy implementation and testing.
On Data Science vs. Quantitative Research
On Data Science vs. Quantitative Research
Data Science is an interdisciplinary field that combines the power of statistics, programming, and domain expertise to derive valuable insights from complex data sets. It involves the process of extracting, cleaning, analyzing, visualizing, and interpreting data to aid in informed decision - making and to discover hidden patterns, trends, and relationships. Data Science leverages advanced analytical techniques, machine learning algorithms, and big data technologies to enable organizations to make data - driven decisions and predictions.
A Data Scientist' s key responsibilities include:
1. Data collection and preprocessing: Data Scientists gather data from various sources, both structured and unstructured, and preprocess it to ensure its quality, completeness, and consistency. This may involve data cleaning, normalization, transformation, and integration.
2. Data analysis: They apply statistical methods, machine learning algorithms, and other analytical techniques to analyze data, identify patterns, and derive insights. Data Scientists often collaborate with domain experts to understand the context and significance of the data.
3. Data visualization and communication: Data Scientists use various visualization tools and techniques to represent data in a visually appealing and easily understandable format. They present their findings to stakeholders and decision-makers, providing data-driven recommendations to support decision - making.
4. Model development and evaluation: Data Scientists build and validate predictive models using machine learning algorithms. They continuously evaluate and refine these models to ensure their accuracy and effectiveness in solving real-world problems.
5. Collaboration: Data Scientists work closely with other team members, including data engineers, analysts, and business professionals, to understand business objectives, provide insights, and develop data - driven solutions.
6. Continuous learning: As the field of data science is rapidly evolving, Data Scientists are expected to stay updated with the latest advancements in analytical techniques, tools, and technologies.
Quantitative Research is a systematic approach to studying various phenomena by gathering and analyzing numerical data. It involves the use of statistical, mathematical, and computational methods to transform raw data into meaningful insights, patterns, or trends. Quantitative research is employed in a wide range of disciplines, including finance, economics, social sciences, psychology, natural sciences, and engineering.
The role of a Quant, short for Quantitative Analyst, typically involves designing, implementing, and evaluating complex mathematical models, algorithms, and computer programs to support decision-making in various industries. In the financial industry, for example, quants are responsible for developing quantitative trading strategies, risk management techniques, and pricing models for financial instruments.
Some key responsibilities of a Quant include:
1. Data Analysis: Quants collect, clean, and analyze large datasets to identify patterns, trends, and correlations. They apply statistical techniques to interpret and draw meaningful insights from the data, which can be used to inform decision-making.
2. Model Development: Quants design and implement mathematical models and algorithms to simulate various scenarios, make predictions, or optimize processes. These models are typically based on theories from finance, mathematics, economics, or other relevant fields.
3. Model Validation: Quants are responsible for testing and validating their models to ensure they are accurate, robust, and reliable. This includes assessing the model’s performance using historical data, out-of-sample testing, and other evaluation techniques.
4. Risk Management: Quants often contribute to the development of risk management strategies by assessing and quantifying various types of risk, such as market risk, credit risk, or operational risk. They also develop tools and models to help mitigate these risks and ensure the organization’s financial stability.
5. Algorithmic Trading: Quants develop and implement algorithmic trading strategies that automatically execute trades based on predefined criteria, such as price, volume, or other market factors. These strategies aim to maximize profits or minimize risks while adhering to regulatory requirements.
6. Communication: Quants collaborate with other professionals, such as traders, portfolio managers, and software engineers, to implement their models and strategies effectively. They also communicate their findings and recommendations to stakeholders and decision-makers within the organization.
In the financial sector, Quants play a critical role in developing trading strategies, managing risk, and enhancing the overall efficiency of financial markets.
1.2 The Equities Entity Store
1.2 The Equities Entity Store
Introduction
Introduction
With the Equities Entity Store I have taken a very different approach to data science. The intention is the same: to facilitate research by sourcing and pre-processing data into a form that is ready for analysis, so that the quant can immediately get to work researching and developing investment theories and trading ideas. This entails much more than simply providing data in electronic format. In fact, there is an entire hierarchy to describe the many different stages data has to go through in order to become computable, as described later in this section.
But the purpose of the Equities Entity Store isn't just to provide data, albeit high quality data in a form that can instantly be consumed as part of the research process. It also offers a framework of research procedures that can be applied to the data, encapsulated in executable code, that will provide a foundation for the analyst' s own unique approach to equity analytics. This framework is structured in the Wolfram technology stack and uses the powerful Wolfram Language as the basis for the computational infrastructure contained in the Equities Entity Store. By combining high-quality computable data with a powerful computational language that incorporates a vast analytical toolkit of pre-built computational algorithms, the Equities Entity Store is designed to act as a productivity multiplier, accelerating the pace of research and producing high quality, actionable output that will feed directly into the creation of production-ready trading systems.
But the purpose of the Equities Entity Store isn't just to provide data, albeit high quality data in a form that can instantly be consumed as part of the research process. It also offers a framework of research procedures that can be applied to the data, encapsulated in executable code, that will provide a foundation for the analyst' s own unique approach to equity analytics. This framework is structured in the Wolfram technology stack and uses the powerful Wolfram Language as the basis for the computational infrastructure contained in the Equities Entity Store. By combining high-quality computable data with a powerful computational language that incorporates a vast analytical toolkit of pre-built computational algorithms, the Equities Entity Store is designed to act as a productivity multiplier, accelerating the pace of research and producing high quality, actionable output that will feed directly into the creation of production-ready trading systems.
The Story Behind the Idea
The Story Behind the Idea
Several years ago in New York I had an interesting discussion with the principal of a HFT firm about his firm’s trading infrastructure. At some point in the conversation I raised the topic of which programming language(s) he considered most suitable for building HFT trading systems, fully expecting him to recite the usual list of suspects, starting with C++ or Java. So I was hugely surprised when he told me that at his firm they used VBA exclusively. I assumed he was joking. Not at all, he said: we do everything in-memory, for which purpose VBA is every bit as fast as C++.
I don’t necessarily agree with his theory, but he had a point: a lot of the friction in trading systems is caused by file i/o operations. If you eliminate those and handle all the computations in-memory, your tick-to-trade time is going to be minimal, regardless of which programming language you use. The problem is that, depending on the information you require for your trading algorithms, this could involve holding vast amounts of data in RAM. Several elegant solutions have been offered to address the problem. One example is Kdb+, a database system that can handle billions of records in a high frequency trading system, by processing them in-memory until they are archived on disk at periodic intervals or at end-of-day.
The idea of handling data in-memory has applications well beyond those of high frequency trading systems, however. And since computer systems come equipped with abundant amounts of RAM, it is now feasible to handle large cross-sectional datasets this way, rather than using a more traditional “front end + SQL database” configuration. The result is a much faster, more elegant and more flexible solution to meet the needs of the analyst.
The Wolfram Mathematica Front End
The Wolfram Mathematica Front End
A key element of this approach is the choice of front end and programming language. Personally, I wouldn't consider VBA to be sufficiently robust or powerful enough to handle the computational requirements of a complex portfolio system, which can be more intricate analytically than a HFT system. C++ is certainly powerful, but too cumbersome and inflexible to easily handle the types of complex queries and analysis that are typically required. This is clearly a task for a language like R, Matlab or Python, which have enormous code libraries containing functions for performing just such complex computational tasks. Any of these would be a perfectly adequate choice, and yet I made a different decision, selecting the Wolfram technology stack with which to build this product. There are several reasons for my preference:
◼
The Wolfram language is an extremely powerful functional programming language with a vast array of built-in libraries for scientific analysis.
◼
The Wolfram technology stack enables the product to scale to as many installations as might be required without performance degradation.
◼
Wolfram has led the field in the area of computational data, much of it built into the technology stack, and incorporates many other OOP concepts that are highly relevant for this application.
◼
The Mathematica notebook is elegant and highly robust, making it an ideal front end for applications of this kind.
Notes
Notes
◼
Computational Data
Computational Data
The point about computational data might not be apparent to those who haven’t come into contact with the concept before, so perhaps a simple illustration is in order. The Wolfram FinancialData function provides access to historical time series for a variety of assets, including equities and foreign exchange, that are available within the Wolfram Language framework. So, for example, we might access historical price data for AAPL:
In[]:=
tsAAPL=FinancialData["AAPL","OHLCV",{{2021,1,3},{2022,12,30}}]
Out[]=
TimeSeries


tsAAPL is a computable object containing daily open, high, low and close prices plus volume for the AAPL stock from the start of 2021.
In[]:=
tsAAPL["MetaInformation"]
Out[]=
{FinancialProperty{Open,High,Low,Close,Volume}}
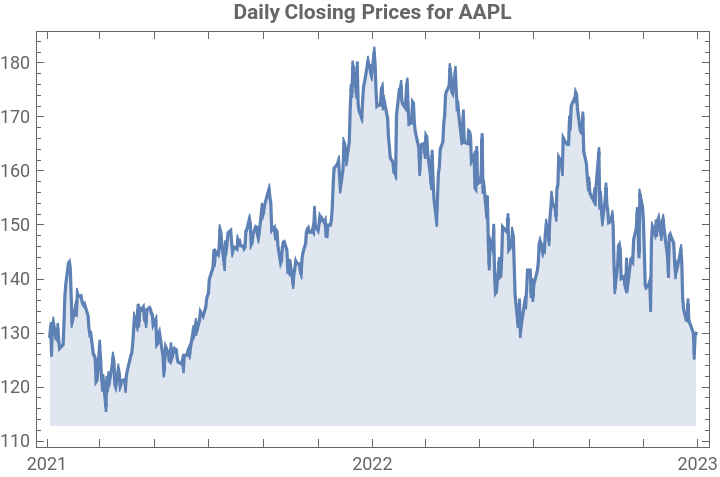
Because the data is computable, we can immediately perform operations on the time series object, for instance plotting the close price of the stock:
In[]:=
DateListPlot[tsAAPL["PathComponent",4],Filling->Axis,PlotLabel->Style["Daily Closing Prices for AAPL",Bold]]
Out[]=
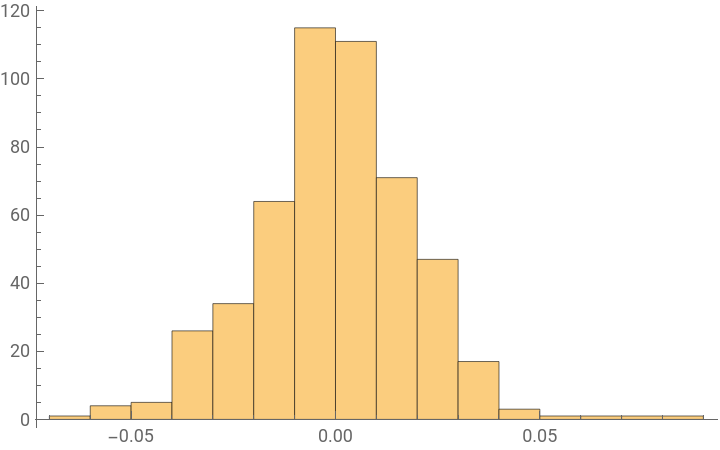
Or we might want to produce a histogram of daily returns:
In[]:=
Histogram@Differences@Log[QuantityMagnitude[tsAAPL["PathComponent",4]["Values"]]]
Out[]=
Or even fit an ARIMA model to the close price data:
In[]:=
TimeSeriesModelFit[QuantityMagnitude[tsAAPL["PathComponent",4]["Values"]]]
Out[]=
TimeSeriesModel
The point is, the data is computable, which means that it can be incorporated immediately into our analysis.
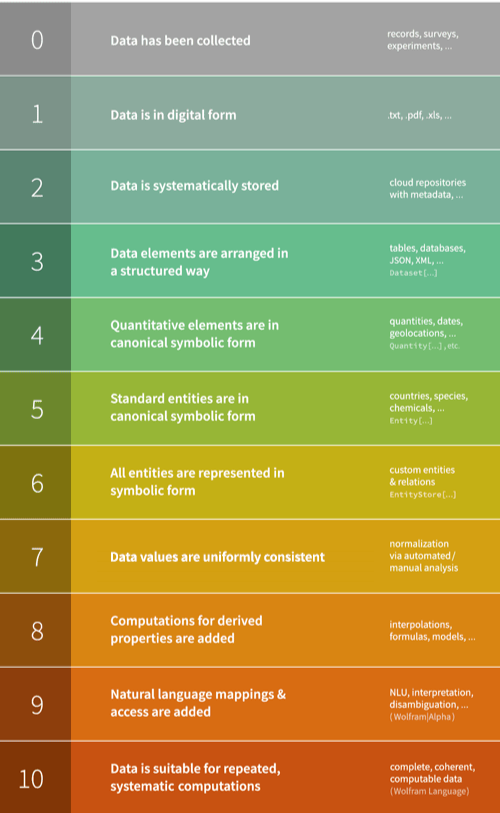
Stephen Wolfram has explained the distinction between data in digital form and computable data in the following way:
Stephen Wolfram has explained the distinction between data in digital form and computable data in the following way:
“My experience in general has been that there’s a definite hierarchy of effort and payoff in getting data to be computable at different levels—starting with the data just existing in digital form, and ending with the data being cleanly computable enough that it can be fully integrated in the core Wolfram Language, and used for repeated, systematic computations.”
In[]:=
Source: Wolfram Research Inc.
Notes
Notes
◼
more information on computational data in the Wolfram framework
◼
◼
Stephen Wolfram's Elementary Introduction to the Wolfram Language
1.3 The Entity Store Data Model
1.3 The Entity Store Data Model
Entity Stores
Entity Stores
This concept of computable data can be extended beyond the data included as standard in the Wolfram technology stack by enabling the user to define their own types of computable data in containers known as Entity Stores. An Entity Store contains user-defined objects (called “entities”) with specified properties and methods. They can be created via a connection to a relational database, or defined in-memory, as is the case with the Equities Entity Store.
The end product is an entity store that contains index entities:
These have properties that contain computable data of a type that is typically very useful in equity analytics and which can be applied immediately in our analysis:
In most cases, each of these has a number of sub-properties, which may be extensive. For example:
And then:
And so on.
Data Structures
Data Structures
The Association Data Type
The Association Data Type
The default data-type for the great majority of data held in Equities Entity Store entities is an Association, such as:
The key-value pairing enables the Wolfram Language to store data in a highly efficient data structure from which data items can be extracted easily and quickly. For example:
Associations in the Wolfram Language vs. Python Dictionaries
Associations in the Wolfram Language vs. Python Dictionaries
The Association data type in the Wolfram Language is a powerful and flexible data structure designed for representing and manipulating associations between keys and values. It is analogous to dictionaries in Python, where keys are mapped to corresponding values, and is particularly useful for organizing and accessing data in a convenient and efficient manner.
In the Wolfram Language, an Association is denoted by <|key1 -> value1, key2 -> value2, ...|>, where the keys and values can be of any data type, including numbers, strings, lists, or other associations.
Some of the key features of Associations in the Wolfram Language include:
1. Flexible keys: Unlike Python dictionaries, where keys must be hashable (i. e., immutable), the Wolfram Language allows for more flexible keys, including lists and other mutable data structures.
2. Query and transformation functions: The Wolfram Language provides several built.in functions for querying and transforming associations, such as KeySelect, KeySort, and Merge.
3. Symbolic representation: Associations in the Wolfram Language have a symbolic representation, which allows for more natural and convenient manipulation of data, particularly when working with symbolic computations. In Python, dictionaries are the closest data structure to Associations in the Wolfram Language. Dictionaries are created using curly braces {key1 : value1, key2 : value2, ...} and provide efficient key.value storage and retrieval.
Some similarities and differences between Associations and dictionaries include:
1. Both are unordered collections of key - value pairs, providing fast lookup and modification.
2. Both support a variety of data types as values; however, Python dictionaries require hashable data types as keys, while Wolfram Language Associations are more flexible in this regard.
3. While Python dictionaries have built - in methods for querying and manipulating data, such as get (), update (), and pop (), the Wolfram Language offers more powerful and expressive functions for working with Associations.
4. Python dictionaries are part of the core language and have native support for JSON data, while Associations in the Wolfram Language are a more recent addition and may require additional parsing for JSON compatibility.
The Association data type in the Wolfram Language and dictionaries in Python are both versatile data structures designed for efficient key - value storage and retrieval. While they share some similarities, Associations in the Wolfram Language offer more flexibility in key choices and provide more powerful functions for querying and transforming data.
Datasets
Datasets
Most data in Equity Entity Store entities is held in the form of Associations, but occasionally data is more naturally stored in the form of another, related data-type, a Dataset, such as in the case of financial statement data. Associations can very easily be converted into Datasets. For example:
Datasets in the Wolfram Language vs. Python DataFrames
Datasets in the Wolfram Language vs. Python DataFrames
Datasets in the Wolfram Language and Python are used for organizing, analyzing, and visualizing structured data in a convenient and efficient manner. While the Wolfram Language has a built - in Dataset data structure, Python offers several libraries, such as pandas and NumPy, to work with datasets. Here, we' ll focus on comparing the Wolfram Language' s Dataset with the pandas DataFrame in Python, as they share similar functionality.
1. Creation and data representation: Wolfram Language: Datasets are created using the Dataset[] function, which takes a list of associations (key - value pairs) or an association of lists as input. Datasets can be nested, allowing for complex hierarchical structures.
Python (pandas): DataFrames are created using the pd. DataFrame () function, which accepts various data structures such as dictionaries, lists, or NumPy arrays. DataFrames have a tabular structure with labeled axes (rows and columns).
2. Data manipulation and querying: Wolfram Language: Datasets provide a rich set of query and manipulation functions, such as Select, Sort, GroupBy, and Join. Wolfram Language also supports a powerful query syntax with operators like #, @, and/*for expressing complex operations.
Python (pandas): DataFrames offer numerous methods for data manipulation, such as .loc[], .iloc[], .query (), .groupby (), and .merge (). Querying in pandas often involves chaining methods or using boolean indexing.
3. Data visualization: Wolfram Language: Datasets can be visualized using built - in functions like ListPlot, BarChart, and Histogram. The Wolfram Language supports dynamic and interactive visualizations with Manipulate and other functions. Python (pandas): DataFrames can be visualized using libraries like Matplotlib, Seaborn, or Plotly. Pandas itself has some basic plotting capabilities through the .plot () method, which is built on top of Matplotlib.
4. Ecosystem and integration: Wolfram Language: Datasets are part of the Wolfram Language ecosystem, which includes Mathematica and Wolfram | Alpha. This provides seamless integration with various built - in functions, symbolic computation capabilities, and the Wolfram Knowledgebase. Python (pandas): Pandas is part of the broader Python ecosystem and has strong integration with other libraries, such as NumPy, SciPy, and scikit - learn. The Python community also offers extensive resources, tutorials, and support.
Both Wolfram Language Datasets and pandas DataFrames in Python are powerful tools for working with structured data. While they share similarities in functionality, the Wolfram Language offers a more symbolic and expressive query syntax, while Python provides a broader ecosystem and strong integration with other libraries.
TimeSeries
TimeSeries
The final data type most widely used in the Equities Entity Store is the TimeSeries. A typical example would be:
TimeSeries objects have an extensive list of properties:
Since they are computable, we can immediately process the data in a TimeSeries object to do things like this:
Time Series in the Wolfram Language vs. Python
Time Series in the Wolfram Language vs. Python
In the Wolfram Language, TimeSeries(more generally, TemporalData) is a built - in data type for representing and analyzing time - dependent data. It provides a convenient and efficient way to store and manipulate data that has been collected or measured at different time points. TimeSeries supports various types of data, such as numeric values, vectors, and associations, and handles irregularly sampled data as well as regularly sampled data. A TimeSeries object in the Wolfram Language is created using the TimeSeries[...] function, which takes a list of data points and their corresponding time values as input. The language offers a rich set of functions for analyzing and manipulating time series data, such as MovingAverage, TimeSeriesForecast, and TimeSeriesResample.
In Python, the nearest equivalent to the Wolfram Language' s TimeSeries is the pandas library' s DataFrame with DateTimeIndex. While not a specific data type for time series, a pandas DataFrame with a DateTimeIndex provides a versatile and powerful way to work with time series data. By using DateTimeIndex, you can take advantage of pandas' extensive functionality for time - based indexing, resampling, and manipulation.
When comparing the TimeSeries in the Wolfram Language and pandas DataFrame with DateTimeIndex in Python:
1. Both allow for convenient and efficient storage and manipulation of time - dependent data.
2. Both handle irregularly and regularly sampled time series data.
3. The Wolfram Language has built - in functions specifically designed for time series analysis, while Python relies on the pandas library and its integration with other libraries like NumPy, SciPy, and scikit - learn for time series analysis.
4. The Wolfram Language offers a more symbolic approach to time series manipulation, while Python relies on pandas' indexing and method - chaining syntax for time series operations.
The TimeSeries data type in the Wolfram Language and pandas DataFrame with DateTimeIndex in Python are both powerful tools for working with time series data. While they offer similar functionality, the Wolfram Language provides built - in time series functions and a more symbolic approach, while Python leverages the pandas library and its broader ecosystem.
Overview of the Equities Entity Store Data Model
Overview of the Equities Entity Store Data Model
Other Entity Stores
Other Entity Stores
The Equity Entity Store product actually provides three different types of entity store:
◼
Equities Entity Store
◼
Sector Index Entity Store
◼
Factor Model Entity Store
The Sector Index and Factor Model entity stores are discussed in Chapters 1.5 and 1.6 respectively.
Equity Entities
Equity Entities
The principal entity types in the Equities Entity Store are equity indices and individual equities. Equity entities contain more data than the equity index entities, which do not contain fundamental data, for example.
Notes
Notes
◼
More on Associations
◼
More on Datasets
◼
More on Timeseries
◼
More on Entity Stores
◼
More on using entity stores with relational databases
2.5 Trading Anomalies
2.5 Trading Anomalies
Anomaly detection, also known as outlier detection, is a method used to identify data points that are significantly different from the majority of the data. These data points are referred to as anomalies or outliers. Anomaly detection techniques are used in various fields such as fraud detection, network intrusion detection, and manufacturing quality control.
There are several techniques used for anomaly detection, including:
Statistical methods: These methods rely on summary statistics of the data to detect anomalies, such as mean, median, and standard deviation. For example, Z - score method considers data points with a Z - score greater than a certain threshold to be anomalies.
Clustering algorithms: Clustering algorithms group similar data points together and anomalies are detected as data points that are far away from their cluster center. For example, K - Means clustering is a popular clustering algorithm used for anomaly detection.
Density - based methods: These methods use a density function to estimate the probability of a data point and identify data points with a low probability as anomalies. For example, the Gaussian Mixture Model can be used to estimate the probability density of the data.
Machine learning - based methods: These methods use machine learning algorithms, such as decision trees and random forests, to model the normal behavior of the data and identify data points that deviate from this behavior as anomalies.
The choice of method for anomaly detection depends on the specific requirements of the task, such as the size and structure of the data, and the desired level of accuracy and computational efficiency.
Introduction
Introduction
One very interesting application of machine learning algorithms is in anomaly detection, in which the aim is to identify unusual observations in a set of data. These methods are now widely used for real-time quality control in manufacturing processes, for example, to ensure that, for example, the dimensions of products on a production line are within stipulated tolerances.
Similar techniques can be applied to time series, including financial time series. In the Equities Entity Store we have implemented algorithms that will identify unusual patterns in the sequences of equity returns and convert these into trading signals. So far as I am aware, there has been no published research on this or any similar methodology and it has been made available for the first time in the initial release of the Equities Entity Store product.
Similar techniques can be applied to time series, including financial time series. In the Equities Entity Store we have implemented algorithms that will identify unusual patterns in the sequences of equity returns and convert these into trading signals. So far as I am aware, there has been no published research on this or any similar methodology and it has been made available for the first time in the initial release of the Equities Entity Store product.
Trading Anomalies in Financial Time Series
Trading Anomalies in Financial Time Series
Let' s illustrate the application of the model using a sample of the daily returns for AAPL, over the period from 2020-2022.
In the plot below there are several sequences in the returns process that are detected as anomalous, which tend to be unusually large positive or negative returns during periods of higher volatility:
In the plot below there are several sequences in the returns process that are detected as anomalous, which tend to be unusually large positive or negative returns during periods of higher volatility:
The anomaly trading algorithm uses machine learning to learn patterns of anomalies in the time series. It then identifies similar anomalies out of sample and generates long or short trading signals. This process is captured in the AnomalyTradingStrategy function, which uses parallel processing to speed up the computationally intensive fitting and application of anomaly detection algorithms.
Portfolio Strategy
Portfolio Strategy
The anomaly trading strategy is intriguing, but it becomes even more so when applied to a portfolio of stocks. For example:
We use the same AnomalyTradingStrategy as above, applied to each stock in turn, and collect the results in an association named AnomalyTradingStrategyResults:
There is considerable variation in the performance of the individual strategies, with AAPL being the best performing strategy on several metrics.
Next, we aggregate all of the individual strategies into an equally-weighted portfolio and review the results.
The combined portfolio performed well, with a total return of 84% from 2020-2022, a yearly growth rate of 24.7%, and a Sharpe ratio of 1.50. The portfolio suffered a moderate drawdown of -8.5% in March 2020, resulting in a Calmar ratio of 2.89.
The combined portfolio performed well, with a total return of 84% from 2020-2022, a yearly growth rate of 24.7%, and a Sharpe ratio of 1.50. The portfolio suffered a moderate drawdown of -8.5% in March 2020, resulting in a Calmar ratio of 2.89.
Conclusion
Conclusion
Anomaly detection is a new strategy R&D method that shows some promise. It works by finding strategies in individual stocks with low correlations due to different times of occurrence of anomalies in the returns. This produces good out-of-sample performance in a small portfolio of stocks.
However, the algorithms are demanding computationally, making this approach impractical for large stock portfolios. Additionally, it is harder to control the market or sector exposure of the portfolio compared to cross-sectional strategies.
However, the algorithms are demanding computationally, making this approach impractical for large stock portfolios. Additionally, it is harder to control the market or sector exposure of the portfolio compared to cross-sectional strategies.
Notes
Notes
4.5 Fundamental Factors in Portfolio Construction
4.5 Fundamental Factors in Portfolio Construction
Quantamental analysis is an investment strategy that integrates quantitative and fundamental analysis. The quantitative aspect involves mathematical models to analyze financial data, identifying patterns and trends. It uses metrics such as price-to-earnings ratios and dividend yields to evaluate companies. On the other hand, fundamental analysis examines a company’s financial health and intrinsic value by assessing its financial statements, management team, and industry trends.
By combining these two approaches, quantamental analysis provides a more comprehensive view of a company’s financial health. It allows investors to make more informed decisions by identifying patterns in financial data and evaluating a company’s management team and industry trends. One of the key benefits is its objectivity, reducing the impact of subjective biases that may influence fundamental analysis. Additionally, it helps investors understand the qualitative factors that may affect a company’s performance.
Another advantage of quantamental analysis is its ability to uncover investment opportunities that might be missed using either quantitative or fundamental analysis alone. By integrating these two methodologies, investors can discover hidden trends and patterns that may indicate a company is undervalued or overvalued.
Investors can use several tools and techniques for quantamental analysis. Machine learning algorithms are commonly used to identify patterns and trends in financial data. These algorithms can find relationships between financial metrics and factors such as economic indicators and management team performance. Sentiment analysis is another technique used to evaluate public perception of a company by analyzing social media and other online sources.
In summary, quantamental analysis combines quantitative and fundamental analysis to provide a more comprehensive view of a company’s financial health. By using both approaches, investors can reduce biases, uncover hidden trends, and identify investment opportunities. As a result, it’s becoming an increasingly popular approach among investors.
Constructing a Value-Oriented Portfolio
Constructing a Value-Oriented Portfolio
In the following case study we will use financial ratios as a basis for constructing a long-only portfolio with the aim of outperforming the benchmark S&P500 index. Specifically, we will select the portfolio of stocks on the basis of their quarterly EV/EBITDA ratio, which expresses the firm’s enterprise value as a multiple of EBITDA (earnings before interest, tax and depreciation). Here we define enterprise value as:
EV = Market Capitalization + (longTermDebt + shortTermDebt) – cashAndEquivalents
A large EV/EBITDA multiple reflects an optimistic assessment of the firm’s value in relation to its EBITDA. This may result from appreciation in the stock price, or increases in the level of short or long-term debt. Arguably, firms with lower EV/EBITDA multiples reflect better value and we might anticipate a reversion-to mean effect, with firms having lower multiples outperforming firms with higher multiples, going forward.
Our approach in this study, which covers the period 2000-2022, is to rank stocks with a market cap of at least $1Bn on the basis of their EV/EBITDA ratio, selecting up to 250 of those with the lowest multiples to form the portfolio. We weight the portfolio, not on the basis of market capitalization, but in proportion to each firm’s EV/EBITDA ratio. We hold the portfolio for one quarter and then rebalance.
In the following code we firm create a series of quarterly rebalancing dates at which the portfolio will be reconfigured and we use the EntityPerformance function to create a time series of quarterly returns in the benchmark S&P 500 index. Then, at each rebalancing date the procedure is as follows:
◼
Select a universe of stocks whose market cap on each rebalancing date is at least $1Bn
◼
Sort those stocks based on their EV/EBITDA ratio as of the rebalancing date. Note the use of the EntityPerformance to extract the ratio value on each date, based on the preceding filing date.
◼
Form a value-oriented portfolio by selecting the 250 stocks with the lowest EV/EBITDA multiples.
◼
Allocate capital in inverse proportion to the EV/EBITA multiple, using the InverseWeighting function.
◼
Measure the performance of the portfolio over the following quarter
◼
Finally, create a quarterly time series of portfolio returns.
The final result is shown in the following chart, which compares the quarterly compounded return in the portfolio against the benchmark S&P500 index. This shows that the portfolio significantly outperforms the index over the 22-year test period:
The results indicate that the portfolio outperforms the benchmark S&P500 index by a compound rate of return amounting to 5.5%:
And while it is the case that the standard deviation of portfolio returns is greater than that of the benchmark, it nonetheless significantly outperforms the index on a risk-adjusted basis:
CITE THIS NOTEBOOK
CITE THIS NOTEBOOK
Equity Analytics: Strategies, Models and Techniques in Computational Finance
by Jonathan Kinlay
Wolfram Community, STAFF PICKS, June 21, 2023
https://community.wolfram.com/groups/-/m/t/2941335
by Jonathan Kinlay
Wolfram Community, STAFF PICKS, June 21, 2023
https://community.wolfram.com/groups/-/m/t/2941335