Ref. 1 investigates the modeling and optimization of the gasification of wood chips. The model has been developed to correlate the gas composition (i.e. H2, CO), lower heating value (LHV), and cold gas efficiency (CGE) in terms of three independent variables : operation time, gas flow rate, and equivalence ratio. To do so, Response Surface Methodology (RSM) is used in conjunction with Box-Behnken design matrix. Our calculations using Mathematica agree closely with the results of Attri and Sharma. These later authors applied Design Expert software.
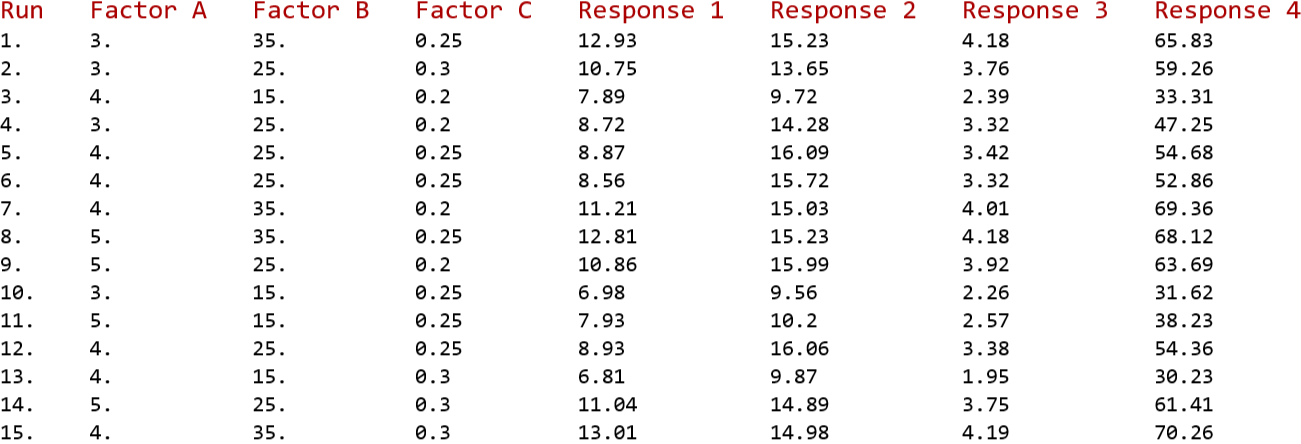
We assume the following responses for a Box-Behnken design matrix
In[]:=
data={{1.,3.,35.,0.25,12.93,15.23,4.18,65.83},{2.,3.,25.,0.30,10.75,13.65,3.76,59.26},{3.,4.,15.,0.20,7.89,9.72,2.39,33.31},{4.,3.,25.,0.20,8.72,14.28,3.32,47.25},{5.,4.,25.,0.25,8.87,16.09,3.42,54.68},{6.,4.,25.,0.25,8.56,15.72,3.32,52.86},{7.,4.,35.,0.20,11.21,15.03,4.01,69.36},{8.,5.,35.,0.25,12.81,15.23,4.18,68.12},{9.,5.,25.,0.20,10.86,15.99,3.92,63.69},{10.,3.,15.,0.25,6.98,9.56,2.26,31.62},{11.,5.,15.,0.25,7.93,10.2,2.57,38.23},{12.,4.,25.,0.25,8.93,16.06,3.38,54.36},{13.,4.,15.,0.30,6.81,9.87,1.95,30.23},{14.,5.,25.,0.30,11.04,14.89,3.75,61.41},{15.,4.,35.,0.30,13.01,14.98,4.19,70.26}};
Factors:
A : Gas flow rate (g/s), B : Operation time (minutes) andC : ER
Responses :
H2 (%) , CO (%) , LHV (MJ/kg) and CGE (%)
A : Gas flow rate (g/s), B : Operation time (minutes) andC : ER
Responses :
H2 (%) , CO (%) , LHV (MJ/kg) and CGE (%)
In[]:=
Join[{{Style["Run",Darker@Red,16],Style["Factor A",Darker@Red,16],Style["Factor B",Darker@Red,16],Style["Factor C",Darker@Red,16],Style["Response 1",Darker@Red,16],Style["Response 2",Darker@Red,16],Style["Response 3",Darker@Red,16],Style["Response 4",Darker@Red,16]}},data]//TableForm
Out[]//TableForm=
Range for factors are used to map coded to real values and vice versa
In[]:=
Mreal=Table[{data[[i]][[2]],data[[i]][[3]],data[[i]][[4]]},{i,1,15}]
Out[]=
{{3.,35.,0.25},{3.,25.,0.3},{4.,15.,0.2},{3.,25.,0.2},{4.,25.,0.25},{4.,25.,0.25},{4.,35.,0.2},{5.,35.,0.25},{5.,25.,0.2},{3.,15.,0.25},{5.,15.,0.25},{4.,25.,0.25},{4.,15.,0.3},{5.,25.,0.3},{4.,35.,0.3}}
In[]:=
Mreal//TableForm
Out[]//TableForm=
3. | 35. | 0.25 |
3. | 25. | 0.3 |
4. | 15. | 0.2 |
3. | 25. | 0.2 |
4. | 25. | 0.25 |
4. | 25. | 0.25 |
4. | 35. | 0.2 |
5. | 35. | 0.25 |
5. | 25. | 0.2 |
3. | 15. | 0.25 |
5. | 15. | 0.25 |
4. | 25. | 0.25 |
4. | 15. | 0.3 |
5. | 25. | 0.3 |
4. | 35. | 0.3 |
In[]:=
low={3,15,0.2};high={5,35,0.3};
In[]:=
mid=0.5(low+high)
Out[]=
{4.,25.,0.25}
In[]:=
halfrange=0.5(high-low)
Out[]=
{1.,10.,0.05}
coded values of the three factors
In[]:=
codedvar=Table[-(mid[[j]]-Mreal[[i,j]])/halfrange[[j]],{i,1,15},{j,1,3}]
Out[]=
{{-1.,1.,0.},{-1.,0.,1.},{0.,-1.,-1.},{-1.,0.,-1.},{0.,0.,0.},{0.,0.,0.},{0.,1.,-1.},{1.,1.,0.},{1.,0.,-1.},{-1.,-1.,0.},{1.,-1.,0.},{0.,0.,0.},{0.,-1.,1.},{1.,0.,1.},{0.,1.,1.}}
In[]:=
codedvar//TableForm
Out[]//TableForm=
-1. | 1. | 0. |
-1. | 0. | 1. |
0. | -1. | -1. |
-1. | 0. | -1. |
0. | 0. | 0. |
0. | 0. | 0. |
0. | 1. | -1. |
1. | 1. | 0. |
1. | 0. | -1. |
-1. | -1. | 0. |
1. | -1. | 0. |
0. | 0. | 0. |
0. | -1. | 1. |
1. | 0. | 1. |
0. | 1. | 1. |
Visualize the design using Graphics3D
In[]:=
Show[Graphics3D[{Darker@Red,PointSize[0.025],Table[Point[codedvar[[i]]],{i,1,15}]}],Axes->True]
Out[]=

Forming MD the Computation Matrix
In[]:=
M=codedvar;
In[]:=
x1=Transpose[M][[1]]
Out[]=
{-1.,-1.,0.,-1.,0.,0.,0.,1.,1.,-1.,1.,0.,0.,1.,0.}
In[]:=
x2=Transpose[M][[2]]
Out[]=
{1.,0.,-1.,0.,0.,0.,1.,1.,0.,-1.,-1.,0.,-1.,0.,1.}
In[]:=
x3=Transpose[M][[3]]
Out[]=
{0.,1.,-1.,-1.,0.,0.,-1.,0.,-1.,0.,0.,0.,1.,1.,1.}
In[]:=
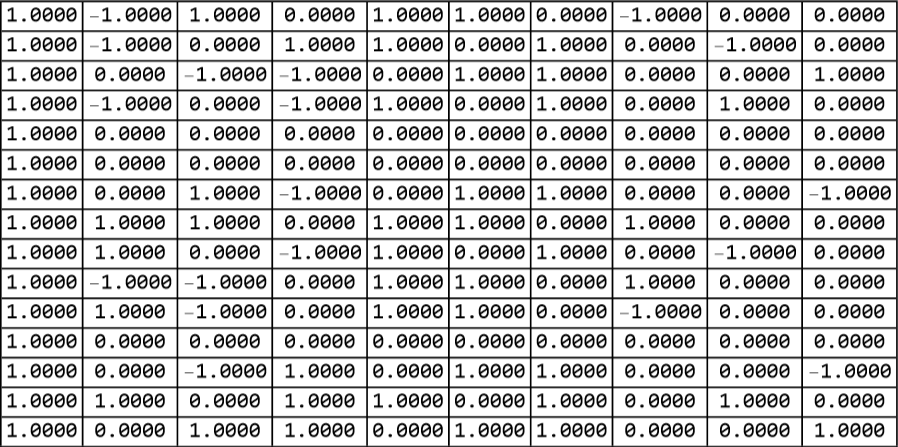
MD=Transpose[{{1.0000,1.0000,1.0000,1.0000,1.0000,1.0000,1.0000,1.0000,1.0000,1.0000,1.0000,1.0000,1.0000,1.0000,1.0000},x1,x2,x3,x1x1,x2x2,x3x3,x1x2,x1x3,x2x3}];
In[]:=
Grid[Table[NumberForm[MD[[i,j]],{4,4}],{i,1,15},{j,1,10}],Frame->All]
Out[]=
Using LinearModelFit to get the model for H2 in %
In[]:=
Clear[x1,x2,x3]
In[]:=
yexp=Table[data[[i]][[5]],{i,1,15}]
Out[]=
{12.93,10.75,7.89,8.72,8.87,8.56,11.21,12.81,10.86,6.98,7.93,8.93,6.81,11.04,13.01}
In[]:=
Dimensions[yexp]
Out[]=
{15}
In[]:=
datalm={MD,yexp}
Out[]=
{{{1.,-1.,1.,0.,1.,1.,0.,-1.,0.,0.},{1.,-1.,0.,1.,1.,0.,1.,0.,-1.,0.},{1.,0.,-1.,-1.,0.,1.,1.,0.,0.,1.},{1.,-1.,0.,-1.,1.,0.,1.,0.,1.,0.},{1.,0.,0.,0.,0.,0.,0.,0.,0.,0.},{1.,0.,0.,0.,0.,0.,0.,0.,0.,0.},{1.,0.,1.,-1.,0.,1.,1.,0.,0.,-1.},{1.,1.,1.,0.,1.,1.,0.,1.,0.,0.},{1.,1.,0.,-1.,1.,0.,1.,0.,-1.,0.},{1.,-1.,-1.,0.,1.,1.,0.,1.,0.,0.},{1.,1.,-1.,0.,1.,1.,0.,-1.,0.,0.},{1.,0.,0.,0.,0.,0.,0.,0.,0.,0.},{1.,0.,-1.,1.,0.,1.,1.,0.,0.,-1.},{1.,1.,0.,1.,1.,0.,1.,0.,1.,0.},{1.,0.,1.,1.,0.,1.,1.,0.,0.,1.}},{12.93,10.75,7.89,8.72,8.87,8.56,11.21,12.81,10.86,6.98,7.93,8.93,6.81,11.04,13.01}}
In[]:=
lm=LinearModelFit[datalm,{1,x1,x2,x3,x1x1,x2x2,x3x3,x1x2,x1x3,x2x3}]
Out[]=
FittedModel
In[]:=
Normal[lm]
Out[]=
8.78667+0.4075x1+0.994167x1x1-0.2675x1x2-0.4625x1x3+2.54375x2+0.381667x2x2+0.72x2x3+0.36625x3+0.561667x3x3
statistical and ANOVA analyses
A small p-value (typically < 0.05) means the variable significantly contributes to explaining the outcome.
A large p-value suggests the variable may not be important in the model and should be dropped from the model equation.
A small p-value (typically < 0.05) means the variable significantly contributes to explaining the outcome.
A large p-value suggests the variable may not be important in the model and should be dropped from the model equation.
In[]:=
lm[{"ParameterTable","RSquared"}]
Out[]=
,0.985875
Estimate | Standard Error | t-Statistic | P-Value | |
1 | 8.78667 | 0.243706 | 36.0543 | 3.0899× -7 10 |
x1 | 0.4075 | 0.149239 | 2.73052 | 0.0412548 |
x2 | 2.54375 | 0.149239 | 17.0448 | 0.0000127192 |
x3 | 0.36625 | 0.149239 | 2.45412 | 0.0576439 |
x1x1 | 0.994167 | 0.219674 | 4.52565 | 0.0062504 |
x2x2 | 0.381667 | 0.219674 | 1.73742 | 0.142818 |
x3x3 | 0.561667 | 0.219674 | 2.55682 | 0.0508427 |
x1x2 | -0.2675 | 0.211056 | -1.26744 | 0.260819 |
x1x3 | -0.4625 | 0.211056 | -2.19136 | 0.0799592 |
x2x3 | 0.72 | 0.211056 | 3.41142 | 0.0190141 |
Comparison of actual (exp .) and predicted values of response (H2 in %)
3-D and contour plot for x3=0
Using LinearModelFit to get the model for CO in %
statistical and ANOVA analyses
A small p-value (typically < 0.05) means the variable significantly contributes to explaining the outcome.
A large p-value suggests the variable may not be important in the model and should be dropped from the model equation.
A small p-value (typically < 0.05) means the variable significantly contributes to explaining the outcome.
A large p-value suggests the variable may not be important in the model and should be dropped from the model equation.
Comparison of actual (exp .) and predicted values of response (CO in %)
3-D and contour plot for x3=0
Using LinearModelFit to get the model for LHV in MJ/kg
statistical and ANOVA analyses
A small p-value (typically < 0.05) means the variable significantly contributes to explaining the outcome.
A large p-value suggests the variable may not be important in the model and should be dropped from the model equation.
A small p-value (typically < 0.05) means the variable significantly contributes to explaining the outcome.
A large p-value suggests the variable may not be important in the model and should be dropped from the model equation.
Comparison of actual (exp .) and predicted values of response (LHV in MJ/kg)
3-D and contour plot for x3=0
Using LinearModelFit to get the model for CGE in %
statistical and ANOVA analyses
A small p-value (typically < 0.05) means the variable significantly contributes to explaining the outcome.
A large p-value suggests the variable may not be important in the model and should be dropped from the model equation.
A small p-value (typically < 0.05) means the variable significantly contributes to explaining the outcome.
A large p-value suggests the variable may not be important in the model and should be dropped from the model equation.
Comparison of actual (exp .) and predicted values of response (CGE in %)
3-D and contour plot for x3=0
References
References
◼
[1] Attri, V., Sharma, A.K. Modelling and optimization of gasification parameters of downdraft gasifier—an RSM approach. Biomass Conv. Bioref. 15, 5383–5400 (2025). https://doi.org/10.1007/s13399-024-05368-w
◼
[2] We also use the ideas for Placing a ContourPlot under a 3D Plot from: https://community.wolfram.com/groups/-/m/t/1148582
CITE THIS NOTEBOOK
CITE THIS NOTEBOOK
Box-Behnken matrix for the modeling and optimization of biomass gasification
by Housam Binous, Asma Hammami, Hatem Dhaoudi and Ahmed Bellagi
Wolfram Community, STAFF PICKS, November 2, 2025
https://community.wolfram.com/groups/-/m/t/3569610
by Housam Binous, Asma Hammami, Hatem Dhaoudi and Ahmed Bellagi
Wolfram Community, STAFF PICKS, November 2, 2025
https://community.wolfram.com/groups/-/m/t/3569610