Temperature-Programmed Desorption
Temperature-Programmed Desorption


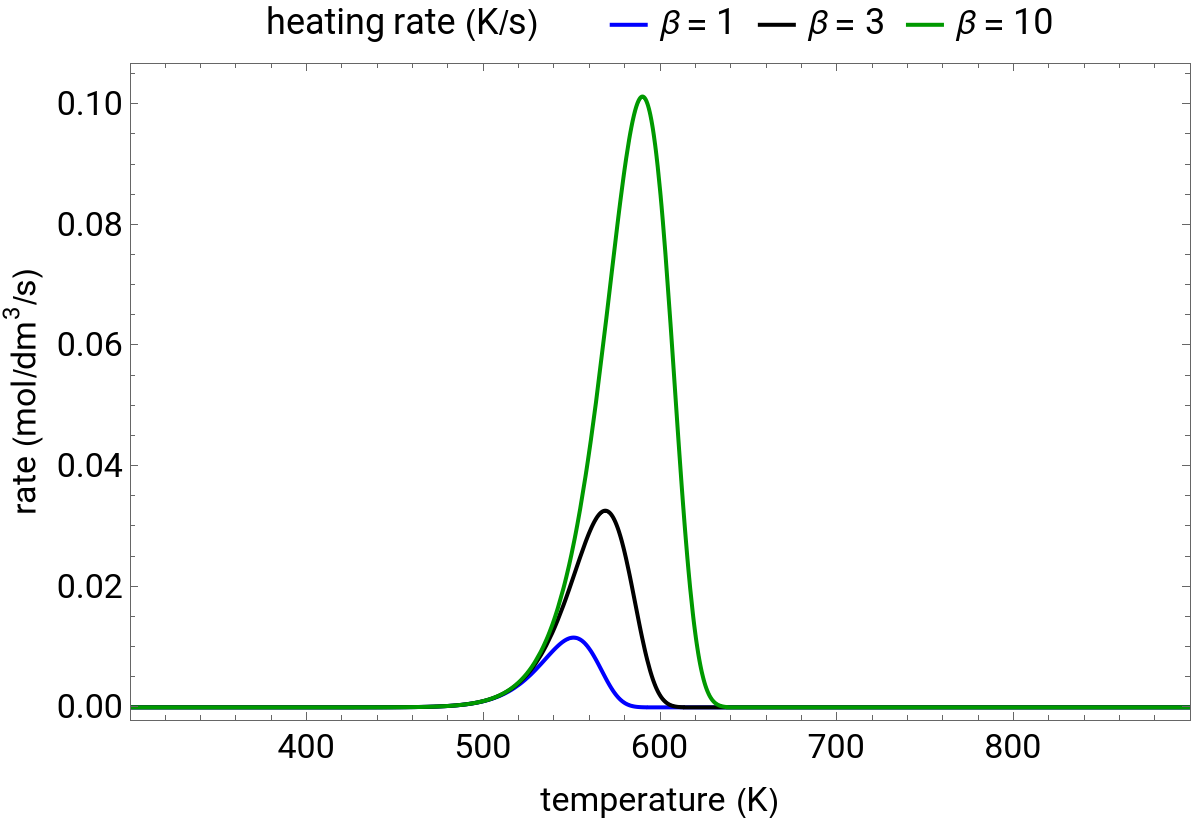
During temperature-programmed desorption (TPD), a molecule is adsorbed on a solid surface, the temperature is ramped linearly with time and the rate of desorption is measured. The rates of desorption are plotted versus either temperature or time (select with buttons) for three heating rates (1, 3 and 10 K/s). Select the desorption order with buttons; vary the desorption activation energy and the initial fractional surface coverage with sliders.
Details
Details
As the heating rate increases, the temperature at which the desorption rate is a maximum (peak temperature) increases, and the maximum rate of desorption increases. When plotted on a time scale, as the heating rate increases, the maximum rate of desorption occurs at shorter times. As the activation energy for desorption increases, the peak temperature increases. This is one of the most widely-used techniques for characterizing catalysts and porous materials and for studying catalytic mechanisms.
Mole balance:
C
A
t
-
E
a
RT
e
n
C
A
where is the concentration of (mol/L), is time (s), at , = is the saturation coverage (mol/L), is order of reaction, is a pre-exponential factor, is activation energy (kJ/mol), is the ideal gas constant (kJ/(mol K)) and is temperature (K).
C
A
A
t
t=0
C
A
C
A,0
n
A
E
a
R
T
Temperature-time relation:
T
t
where is the heating rate (K/s).
β
The screencast video at[1] shows how to use this Demonstration.
References
References
[1] Temperature-Programmed Desorption[Video]. (Jan 20, 2017) www.learncheme.com/simulations/kinetics-reactor-design/temperature-programmed-desorption.
Permanent Citation
Permanent Citation
Rachael L. Baumann, John L. Falconer, Nick Bongiardina
"Temperature-Programmed Desorption"
http://demonstrations.wolfram.com/TemperatureProgrammedDesorption/
Wolfram Demonstrations Project
Published: June 20, 2013