TraCOV: What’s your risk level for COVID-19?
Jessica Shi, Claire Morton, Anwesha Das, Aranyo Ray
Try out our webapp: https://www.tracov.tech
Please vote for our project on DevPost for the People’s choice award at our hackathon: https://devpost.com/software/tracov
Please vote for our project on DevPost for the People’s choice award at our hackathon: https://devpost.com/software/tracov
Introduction
Introduction
Our hackathon team has taken on another project at the virtual hths.hacks() hackathon. Our project is titled TraCOV.
Even though there are many sources of coronavirus data, it can be difficult for individuals to calculate and understand their risk level for contracting the coronavirus. We wanted to design a tool that uses reliable data to help individuals understand and visualize how at-risk they are.
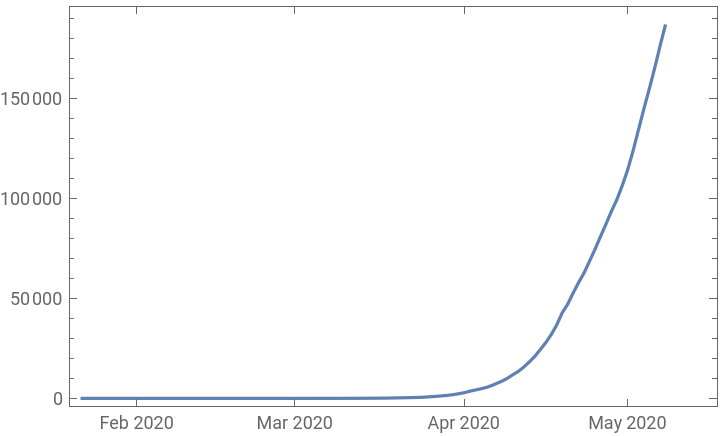
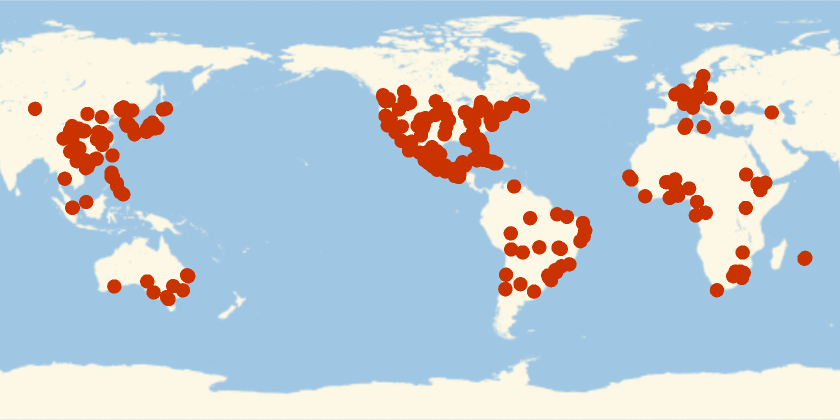
The web tool takes an input of the user’s age, country, and gender, as well as any pre-existing chronic conditions. It uses data from Wolfram and the United Nations to calculate the proportion of new cases in the last five days to the country’s population and the proportion of people of the user’s age and gender with the coronavirus to the global population in that demographic group. These proportions are added together to form an overall measurement of risk, and this measurement is categorized as “Low,” “Moderate,” “High,” or “Very High.” Users can also view a map of worldwide cases of their age and gender and a graph of confirmed cases in their country, as well as the death rate for cases of their age and gender and the number of cases from patients with their pre-existing conditions.
The web tool takes an input of the user’s age, country, and gender, as well as any pre-existing chronic conditions. It uses data from Wolfram and the United Nations to calculate the proportion of new cases in the last five days to the country’s population and the proportion of people of the user’s age and gender with the coronavirus to the global population in that demographic group. These proportions are added together to form an overall measurement of risk, and this measurement is categorized as “Low,” “Moderate,” “High,” or “Very High.” Users can also view a map of worldwide cases of their age and gender and a graph of confirmed cases in their country, as well as the death rate for cases of their age and gender and the number of cases from patients with their pre-existing conditions.
How it works
How it works
Gender-age risk level
Gender-age risk level
We decided to divide the cases with that demographic by the total population matching that demographic and multiplying by 100 to get the gender-age risk level.
Figure out which interval (in tens) the age input is in
In[]:=
findinterval[age_]:=First@Select[Map[Interval[#]&,Partition[{1,9,10,19,20,29,30,39,40,49,50,59,60,69,70,79,80,89,90,99},2]],IntervalMemberQ[#,age]&]
Select the data with the same sex and in the age interval
In[]:=
finddata2[sex_,age_]:=Select[(Select[ResourceData["Patient Medical Data for Novel Coronavirus COVID-19"][Select[!MissingQ[#Age]&&!MissingQ[#Sex]&]],IntervalMemberQ[findinterval[age],#Age]&]),ContainsAll[#,{sex}]&]
Find the population with the same demographic (data from the United Nations)
In[]:=
finddemo[sex_,age_]:=IfMatchQsex,,Which[Between[age,{0,9}],650021,Between[age,{10,19}],605324,Between[age,{20,29}],577734,Between[age,{30,39}],564666,Between[age,{40,49}],482532, Between[age,{50,59}],418797,Between[age,{60,69}],305665,Between[age,{70,79}],170518,Between[age,{80,89}],74710,Between[age,{90,99}],14408],Which[Between[age,{0,9}],692361,Between[age,{10,19}],648139,Between[age,{20,29}],650139,Between[age,{30,39}],652139,Between[age,{40,49}],482532, Between[age,{50,59}],414825,Between[age,{60,69}],286119,Between[age,{70,79}],141941,Between[age,{80,89}],49406,Between[age,{90,99}],6406]
Calculate the risk level according to sex and age
In[]:=
calcrisk[sex_,age_]:=N[Length@finddata2[sex,age]/finddemo[sex,age]]*100
In[]:=
calcrisk,72
Out[]=
0.329584
In[]:=
calcrisk,24
Out[]=
0.17309
We can see above that the risk for a female, 72 is much higher than a female, 24.
Country risk level
Country risk level
We decided to divide the cases with that demographic by the total population matching that demographic and multiplying by 100 to get the gender-age risk level.
Find the confirmed case data for the country
In[]:=
countrydata[country_]:=(First@Normal[Select[ResourceData["Epidemic Data for Novel Coronavirus COVID-19","WorldCountries"],MemberQ[#,country]&]])["ConfirmedCases"]
Plot the confirmed cases in the country
In[]:=
ccplot[country_]:=DateListPlot[countrydata[country]]
In[]:=
ccplot
Out[]=
Find the increase in cases in the past five days
In[]:=
calccountryinc[country_]:=countrydata[country]["Values"][[-1]]-countrydata[country]["Values"][[-5]]
For the country risk level, we divided the confirmed cases in the past five days by the country’s population and multiplied by 1000.
Find the ratio of case increase to the country’s population
In[]:=
calccountryrisk[country_]:=N[calccountryinc[country]/(QuantityMagnitude[CountryData[country, "Population"]])]*1000
In[]:=
calccountryrisk
Out[]=
0.0000156082
In[]:=
calccountryrisk
Out[]=
0.291728
In the examples above, the risk for China is much lower than the risk for the United States.
Total Risk, death rate, and risk levels
Total Risk, death rate, and risk levels
Add the two risks to find total risk
In[]:=
calctotalrisk[country_, sex_, age_]:= N[calccountryrisk[country]+calcrisk[sex,age]]
Plot all the cases in that demographic geographically
In[]:=
plotcases[sex_, age_] :=GeoListPlot[Map[#["GeoPosition"]&, finddata2[sex, age]]//Normal]
In[]:=
plotcases,50
Out[]=
Find the number of deaths out of confirmed cases in the gender/age group
In[]:=
calcdeathrate[sex_,age_] :=StringJoin[{ToString@ Length@Select[finddata2[sex,age],#["DeathQ"]&]," out of ",ToString@Length[finddata2[sex,age]]}]
In[]:=
calcdeathrate,65
Out[]=
25 out of 1333
Classify the risk into a “risk level”
In[]:=
riskgen[word_, color_] := Style[word, Background color]
In[]:=
risklevel[risk_] := Which[0≤ risk<.20,riskgen["Low Risk",LightGreen],.20≤ risk<.40,riskgen["Moderate Risk",LightYellow],.40≤ risk<.60,riskgen["High Risk",LightOrange],.60≤ risk<1,riskgen["Very High Risk",LightRed]]
In[]:=
risklevelcalctotalrisk,,85
Out[]=
Very High Risk
In the example above, a female, 85 living in the United States would have a Very High Risk for COVID-19.
Chronic conditions
Chronic conditions
We decided to not include chronic conditions as part of the “risk” calculation, but we inform the user of how many reported cases there are.
Make a list of diseases/chronic conditions the user can choose from
In[]:=
diseases=Prepend[Normal@DeleteDuplicates@Flatten@DeleteMissing@ResourceData["Patient Medical Data for Novel Coronavirus COVID-19"][All,"ChronicDiseases"],"NONE"];
Find how many cases of the chronic condition were reported
Summary of all the collected information
Summary of all the collected information
Give a summary of all information
This is an example of all of the information that we collect put all together.
Example output
Make a form page and send it to the cloud
Conclusion
Conclusion
The biggest challenge with this project was deciding which data to show to users. We wanted to create an intuitive tool that outputs useful information. Ultimately, we decided that individualized risk levels were the best way to combine the available data and help users understand how the coronavirus could impact them. We are most proud of designing, coding, and presenting a brand-new concept in 24 hours. This project taught us how to think about data. In order to connect people to enormous sets of data, we had to think carefully about how to design a tool that took user input and was able to output useful and understandable pieces of information for laypeople. In the future, we hope to use a larger dataset, such as the Johns Hopkins coronavirus data, to make more precise and accurate risk level assessments.