CITE THIS NOTEBOOK: Multibrot sets visualization and area estimation by Shuheng Li. Wolfram Community NOV 10 2022.
I was playing around with generating images for Multibrot sets (a generalization of the Mandelbrot set, where the set consists of complex numbers c such that z^d+c remains bounded after repeated function composition, starting with the origin, and in the case of the Mandelbrot set d is chosen to be 2), and reproduced some interesting looking visualizations of the multibrot sets. I also wrote a simple function that approximates the area of such sets.
Escape condition functions
Escape condition functions
In[]:=
iterator[c_,iterations_Integer,d_]:=If[Abs[NestWhile[#^d+c&,0,Abs[#]<2&,1,iterations]]<2,1,0]
In[]:=
MultibrotPlot[n_Integer,iterations_Integer,d_]:=ParallelTable[iterator[N[j+i*],iterations,d],{i,-2,2,4/n},{j,-2,2,4/n}]//ArrayPlot
These functions uses the escape condition |z|<2 to determine whether a point lies in the Multibrot set.
Multibrot visualization
Multibrot visualization
Here we animate the progression of the multibrot set as the power of z ranges from 1 to 8 in steps of 0.1, producing a truly mesmerizing sight!
In[]:=
multibrotAnimate[n_Integer,iterations_Integer,d0_,df_]:=With[{A=Table[MandelBrotPlot[n,iterations,d0+i],{i,0,df,0.1}]},ListAnimate[A]]
In[]:=
multibrotAnimate[1000,200,1,8]
Out[]=
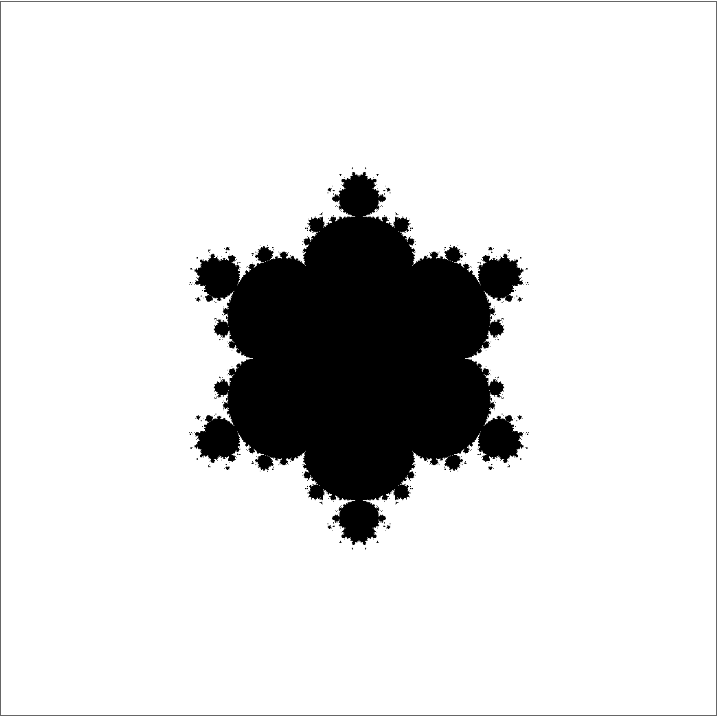
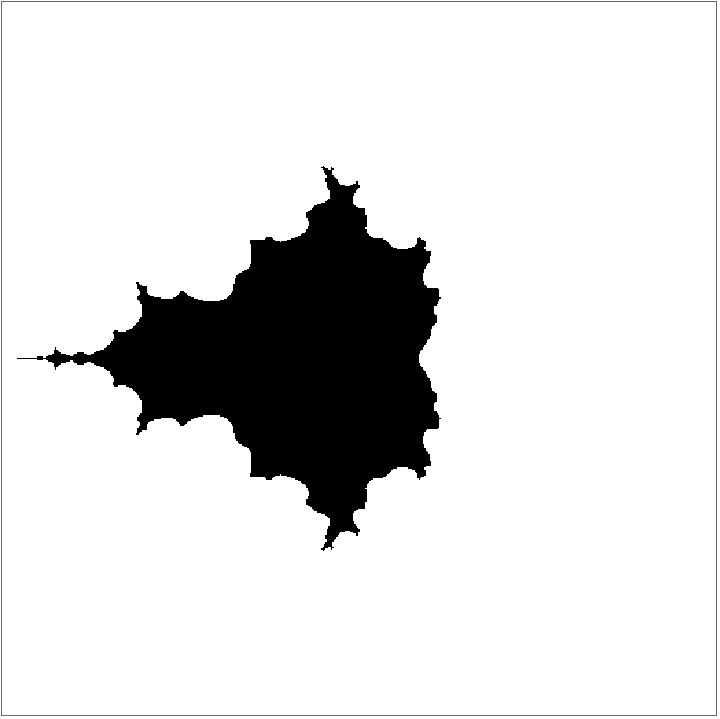
We can also animate the evolution of the Mandelbrot set as the number of iterations on z^2+c increases:
MandelbrotProgression[n_Integer,iterations_Integer]:=With[{A=Table[MultibrotPlot[n,i,2],{i,1,iterations,1}]},ListAnimate[A]]
In[]:=
MandelbrotProgression[500,15]
Out[]=
Area estimations
Area estimations
While the theoretical area of the Mandelbrot set is yet unknown, we can easily approximate the area of the multibrot sets with tiny squares:
In[]:=
AreaEstimate[n_Integer,iterations_Integer,d_]:=ParallelSum[iterator[N[j+i*],iterations,d],{i,-2+4/n,2,4/n},{j,-2+4/n,2,4/n}]*16/n^2//NAreaEstimate[2000,500,2]
Out[]=
1.51519
We can do this for multibrot sets as well, and letting the power of z range from 1 to 10 in steps of 1, we have a visualization of how the area of multibrot sets scale with the degree of the function:
In[]:=
ListPlot[AreaEstimate[2000,250,#]&/@Range[1,10,1],Joined->True]
Out[]=