This post is inspired by the Mathematica StackExchange question which, again, was based on a X/Twitter post. Although these plots involve “insects”, it’s really all about suitable randomness and human visual interpretation of it. A suitably continuous function with random parameters is being sampled; in my case it’s four-dimensional but technically one dimension for individual paths and two dimensions for multiple paths (represented below as different hues) would be sufficient; I just wanted to pedagogically separate the function being sampled and the effects of the range on it which gets sampled. One could also shift the sampled region around and vary the results slightly which wouldn’t be possible in the same way if the whole periodic function range would be sampled for each plot.
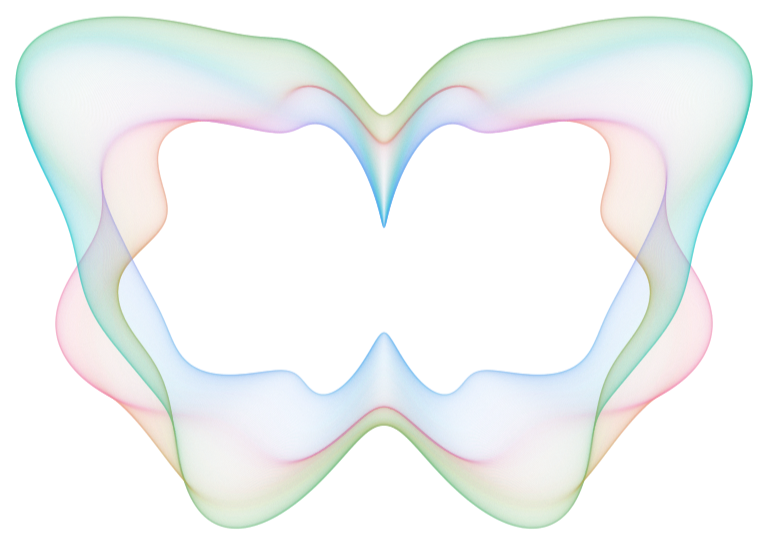
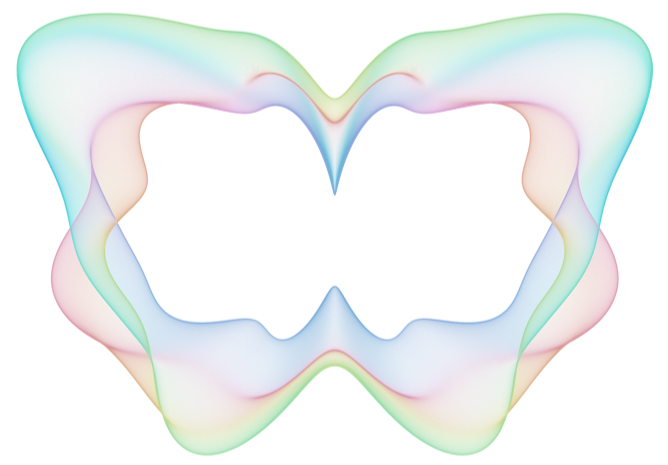
Most animals in nature exhibit bilateral symmetry. The plotted data can be made symmetric along one axis by many ways, and here it’s just about summing values of the above function mirrored along the y axis. This, like Rorschach ink blots, springs human imagination into life and many of the plots resulting from purely random data resemble some sorts of creatures - often insects or bugs - as a result.
Seed for randomness in “noise”
seed=54;
Distance range from the origin
range={1,15};
Points along the a and z directions
na=1000;nz=500;
Raster size for later renderings
rastersize=2000;
Number of frequency terms per dimension
terms=6;
Basis for scaling down higher frequencies
basis=1.3;
Four - dimensional “noise” function - close - by coordinates have more similar values than far away
SeedRandom[seed];noise=Compile[{{x,_Real},{y,_Real},{z1,_Real},{z2,_Real}},(*essentiallyamixofrandomsinewavesinfourdimensions*)Evaluate[Sum[(basis^-(i+j+k+l))RandomReal[{-1,1}]Sin[Pi(ix+RandomReal[{-1,1}])]Sin[Pi(jy+RandomReal[{-1,1}])]Sin[Pi(kz1+RandomReal[{-1,1}])]Sin[Pi(lz2+RandomReal[{-1,1}])],{i,0,terms},{j,0,terms},{k,0,terms},{l,0,terms}]]];
A list of distances from origin for every color
distances=ParallelTable[Table[With[{(*xandyaretheregularvaluesalongthecircle*)x=Sin[a],y=Cos[a],(*z1andz2arevaluesaroundthetwootherdimensions,fordifferentcolors*)z1=Sin[z],z2=Cos[z]},(*summingmirroredversionsmaketheresultsymmetricalongxaxis*)noise[x/2,y/2,z1/10,z2/10]+noise[-x/2,y/2,z1/10,z2/10]],{a,0.,2Pi,2Pi/na}],{z,0.,2Pi(1-1/nz),2Pi/nz},Method->"CoarsestGrained"]//(*onceadistancelistforeverycolorhasbeencomputedscaleallofthemontherange*)Rescale[#,MinMax[Flatten[#,1]],range]&;
Corresponding points on the unit circle
circlepoints=Table[{Sin[a],Cos[a]},{a,0.,2Pi,2Pi/na}];
Colors for every distance list
colors=Table[LABColor[0.7,0.41Sin[h],0.41Cos[h]],{h,0,2Pi(1-1/nz),2Pi/nz}];
Actual point lists in the {x, y} form, scaling circlepoints with distances
points=MapThread[#1#2&,{circlepoints,#}]&/@distances;
Separate lines for graphics
lines=Line/@points;
Actually plot a bug
Graphics[{(*draweverythingwiththinsemi-transparentlines*)Thin,Opacity[1/4],(*littletweaksonrendering*)CapForm[None],JoinForm[None],(*everylinewithitscolor*)Transpose[{colors,lines}]},ImageSize->Large]
Out[]=
Compute coordinate bounds for image stacking
bounds=CoordinateBounds[Flatten[points,1],Scaled[0.025]];
Compute maximum brightness across a stacked image
brightness=Fold[ImageAdd[#1,Image[Rasterize[Graphics[{White,Thin,CapForm[None],JoinForm[None],#2},Background->Black,PlotRange->bounds],RasterSize->rastersize],"Real"]]&,(*real-valuedblackstartingimage*)Image[Rasterize[Graphics[Background->Black,PlotRange->bounds],RasterSize->rastersize],"Real"],lines];
Stack colored lines, each on separate image
hues=Fold[(*addanimagewithonecolortotheprevious*)ImageAdd[#1,Image[Rasterize[Graphics[{Thin,CapForm[None],JoinForm[None],#2},Background->Black,PlotRange->bounds],RasterSize->rastersize],"Real"]]&,Image[Rasterize[Graphics[Background->Black,PlotRange->bounds],RasterSize->rastersize],"Real"],Transpose[{colors,lines}]];
(*dosomead-hoccompositionmagicwithhuesandbrightnesses-withalphachannel*)alphaimage=ColorSeparate[ColorConvert[hues/Max[brightness],"HSB"]]//ColorCombine[{#[[1]],0.8#[[2]],ConstantImage[0.85,ImageDimensions[hues]],ColorConvert[brightness/Sqrt[Max[brightness]],"Grayscale"]^(1/1.5)},"HSB"]&//(*convertintoaregular8-bitRGBAimage*)Image[ColorConvert[#,"RGB"],"Byte"]&
Out[]=
With black background
Seed 56
Seed 60
Seed 62
Seed 64
Seed 80
Seed 84
Seed 86
Seed 87
Seed 91
Seed 98
Seed 102
CITE THIS NOTEBOOK
CITE THIS NOTEBOOK
Insect-shaped mandalas: 4D noise mapped to 2D distance-based color and line generation
by Jari Kirma
Wolfram Community, STAFF PICKS, January 28, 2025
https://community.wolfram.com/groups/-/m/t/3366045
by Jari Kirma
Wolfram Community, STAFF PICKS, January 28, 2025
https://community.wolfram.com/groups/-/m/t/3366045