On July 24, 2023, there was an explosion on the far side of the Sun. Triggered by an unseen solar flare, this explosion hurled a large amount of solar material into space, a coronal mass ejection (CME).
In[]:=
cme=With[{date=DateObject[{2023,7,24,18,0,0},TimeZone->0]},With[{dr=DateRange[date,date+Quantity[4.5,"Hours"],Quantity[10,"Minutes"]]},ResourceFunction["SolarImage"][dr,5,"Colorize"->True]]];
In[]:=
SlideShowVideo[cme["Values"]]
Out[]=
A few days later on July 28, the Sun unleashed a very photogenic solar flare
In[]:=
flare=With[{start=DateObject[{2023,7,28,15,30},TimeZone->0]},ResourceFunction["SolarImage"][DateRange[start,start+Quantity[1,"Hours"],Quantity[5,"Minutes"]],13,"Colorize"->True]];
In[]:=
SlideShowVideo[flare["Values"]]
Out[]=
The above animations use the SolarImage Wolfram Function Repository (WFR) item which makes it easy to visualize these explosions along with other solar events that trigger the space weather we experience here on Earth .
In the above animation, the surface of the Sun is obscured by a mask on board the SOHO spacecraft so that the fainter coronal region can be observed. Although not obvious from this animation, the majority of the material was ejected opposite from Earth so major geo effects are not expected.
Although Earth isn’t in the line of sight of the impacts of this event, Europe’s Solar Orbiter was on the opposite side of the Sun from the Earth’s point of view. The relative positions of Earth and Solar Orbiter can be seen using another WFR. Solar Orbiter detected the event 32 hours after it happened.
In[]:=
eventdate=DateObject[{2023,7,24,18,0,0},TimeZone->0];
In[]:=
ResourceFunction["SolarSystemPlot3D"]Red,Sphere,.03,eventdate
Out[]=

In[]:=
traveltime=Quantity[32,"Hours"];
At the time of detection, the Solar Orbiter was over 86 million miles from the Sun:
In[]:=
dist=[Dated["DistanceFromSun",eventdate+traveltime]]
Out[]=
Systems on board the spacecraft detected the event about 32 hours later. Using basic math, this implies an average speed of 2.7 million miles per hour, a very powerful event!
In[]:=
FormulaData[{"DistanceSpeedTime","ConstantSpeed"},{"t"->traveltime,"d"->dist}]/.q_?QuantityQ:>UnitConvert[q,"Miles"/"Hours"]
Out[]=
v
Bastille Day Event
Bastille Day Event
The SpaceWeatherData WFR has been available for some time now and allows us to explore the quantitative effects of space weather. For example, historical records have allowed the “counting” of sunspots and the results of these counts result in the official sunspot number which totals individual sunspots along with weighted sunspot groups. Since the 1600’s the sunspot number has allowed us to recognize the Sun has an 11 year sunspot cycle with solar minimum during periods of low sunspot numbers and solar maximum during periods of high sunspot numbers.
In[]:=
annualsunspotts=ResourceFunction["SpaceWeatherData",ResourceSystemBase->"https://www.wolframcloud.com/obj/resourcesystem/api/1.0"][{DateObject[{1611}],DateObject[{2018}]},"YearlySunspotNumber"];
In[]:=
DateListPlot[annualsunspotts]
Out[]=
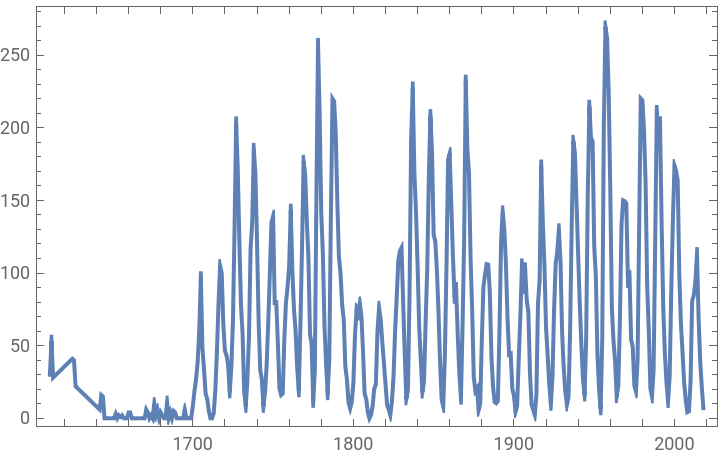
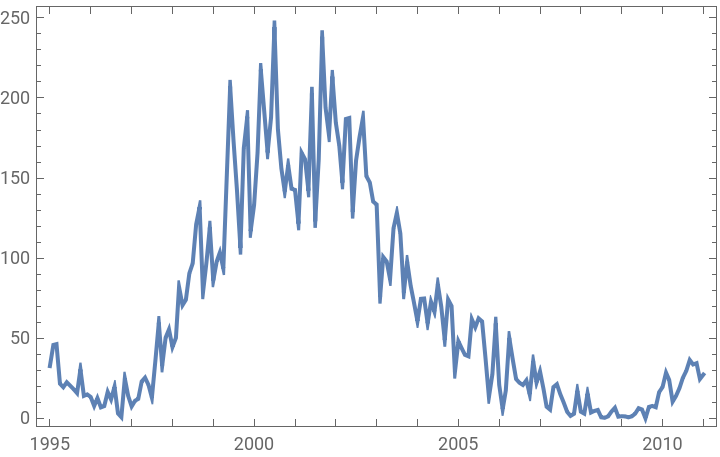
Correlated with sunspot numbers, solar flares usually originate from sunspots groups. For example, on July 14, 2000 there was a powerful space weather event known as the Bastille Day event. This even happened near a solar maximum as seen in the following plot.
In[]:=
DateListPlot[ResourceFunction["SpaceWeatherData",ResourceSystemBase->"https://www.wolframcloud.com/obj/resourcesystem/api/1.0"][{DateObject[{1995}],DateObject[{2011}]},"MonthlySunspotNumber"]]
Out[]=
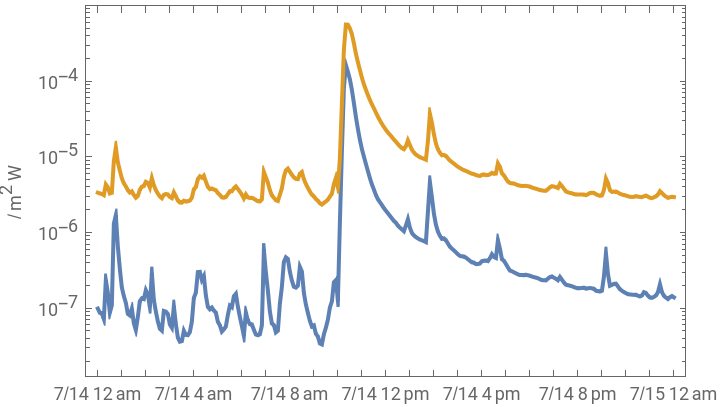
SpaceWeatherData also allows us to visualize the X-ray emissions from the Sun corresponding to a powerful solar flare.
In[]:=
xrayts=ResourceFunction["SpaceWeatherData"][{DateObject[{2000,7,14,0,0,0},TimeZone->0],DateObject[{2000,7,15,0,0,0},TimeZone->0]},{"ShortSolarXRayFlux","LongSolarXRayFlux"}];
In[]:=
DateListLogPlot[xrayts,FrameLabel->{None,Automatic}]
Out[]=
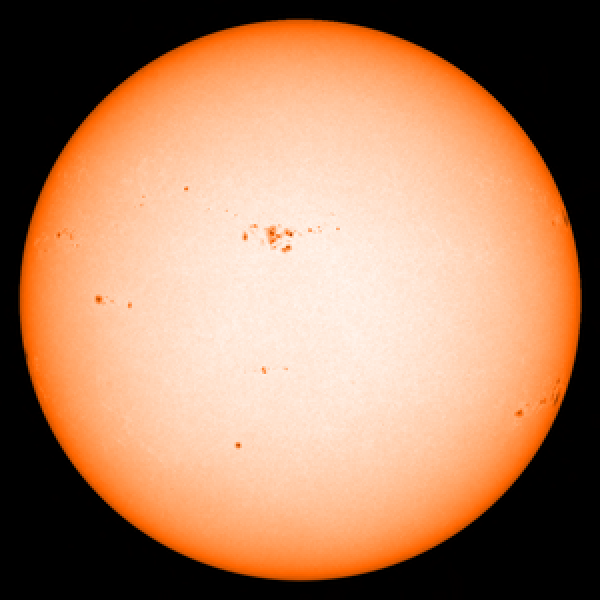
With SolarImage, its now possible to visualize what the Sun looked like during this event. The following image shows the view of the Sun from the SOHO spacecraft. The cluster of sunspots just above and left of center is the origin of the Bastille Day Event.
In[]:=
ResourceFunction["SolarImage"][DateObject[{2000,7,14,0,0,0},TimeZone->0],7,"Colorize"->True]
Out[]=
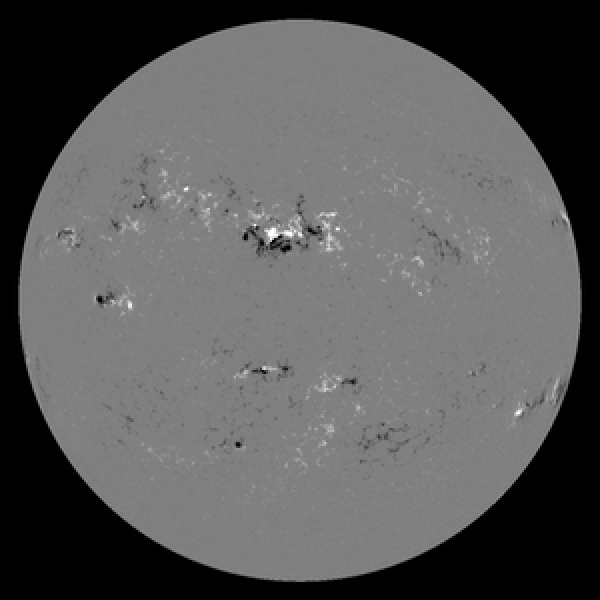
The corresponding magnetic fields from this sunspot group, which can be seen in this magnetogram, became unstable.
In[]:=
ResourceFunction["SolarImage"][DateObject[{2000,7,14,0,0,0},TimeZone->0],6]
Out[]=
As a result of the instability, magnetic field lines reconnected and unleashed a powerful solar flare that can be seen in the following animation which provides a view of the Sun at 195 Angstroms which is in the extreme ultraviolet.
2003 Halloween Storms
2003 Halloween Storms
3 years after the Bastille Day Event, there was another solar event near Halloween in 2003. SpaceWeatherData shows a double spike of X-rays from the Sun.
This time, the face of the Sun looked even more impressive with several groups of sunspots.
Observing in extreme ultraviolet, a pair of powerful solar flares can be seen coming from the sunspot group below and left of center.
The “static” that appears in the images following the flares are the result of particles from the Sun being accelerated to near light speed and then hitting the SOHO detectors.
Filaments
Filaments
Besides solar flares, another feature that can be created by complex magnetic fields on the Sun are solar filaments. These are long spans of solar plasma held above the surface of the Sun, often forming vast arcs. The gas is usually cooler than surrounding gas so they usually appear darker. Here’s a solar filament that formed and then erupted in January 2023.
Another, more impressive eruption happened in August of 2012.
Coronal Holes
Coronal Holes
Although not as dynamic as the events shown previously, coronal holes can form on the Sun that “open windows” in the solar atmosphere allowing high-speed particle streams from the Sun to emerge nearly unobstructed. These appear as large dark areas on the Sun when observed in ultraviolet. The following 193 Angstrom image of the Sun shows a large coronal hole above center.
The high speed particle streams from coronal holes can buffet the Earth’s magnetic field like a flag on a windy day and create auroral activity near the poles.
As we head towards solar maximum, having SolarImage available will allow for some nice visuals of any solar events that appear as a result.
CITE THIS NOTEBOOK
CITE THIS NOTEBOOK
Exploring the origins of space weather
by Jeff Bryant
Wolfram Community, STAFF PICKS, August 1, 2023
https://community.wolfram.com/groups/-/m/t/2980893
by Jeff Bryant
Wolfram Community, STAFF PICKS, August 1, 2023
https://community.wolfram.com/groups/-/m/t/2980893