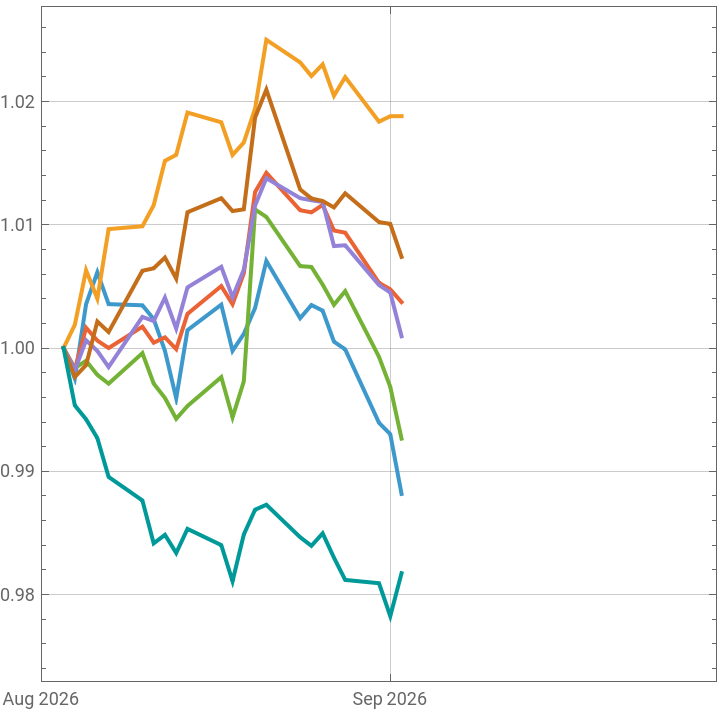
Currency values
Currency values
In[]:=
stdate={2026,8,1};(*startingdate.Allcurrenciesequalto1.00*)enddate=Today;(*endingdatetoshow*)currencies={{"SEK","Swedish Krona(SEK)"},{"MXN","Mexican Peso (MXN)"},{"CHF","Swiss Franc (CHF)"},{"EUR","Euro (EUR)"},{"GBP","British Pound (GBP)"},{"CAD","Canadian Dollar (CAD)"},{"JPY","Japanese Yen (JPY)"}};DateListPlot[Table[FinancialData[currencies[[i,1]]<>"/USD",stdate]/(FinancialData[currencies[[i,1]]<>"/USD",stdate][DateObject[stdate]]),{i,1,Length[currencies]}],(*numeratorwithcurrencytimeseries,denominatorwithdollarvalueatstartingdate*)PlotLegends{currencies[[All,2]]},PlotRange->{{stdate,enddate},{Automatic,Automatic}},GridLines->Automatic,PlotTheme->"Square",ImageSize->Medium]
Out[]=