The vector-borne disease (VBD) models, in addition to the human population, we also need to represent the vector to model transmission events We will use this model to explore the effect of varying vector - related parameter values on infection prevalence in humans . To keep it simple, we are only including a single serotype within the model . The differential equations for the mosquito population dynamics are :
d
S
V
dt
μ
V
N
V
a
b
V
N
H
S
V
I
H
μ
V
S
V
d
I
V
dt
a
b
V
N
H
S
V
I
H
μ
V
I
V
The differential equations for the human host population dynamics are :
The differential equations for the human host population dynamics are :
d
S
H
dt
a
b
H
N
H
S
H
I
V
d
I
H
dt
a
b
H
N
H
S
H
I
V
I
H
d
R
H
dt
I
H
Based on information from Nishiura [1], develop a model of a closed system of 20, 000 vectors and 10, 000 humans, assuming an infection prevalence of 0.28 % in humans and 0.057 % in mosquitoes and that everyone else is susceptible . The parameter values for this dengue model are as follows :
◼
Biting rate
a1day
-1
s
◼
Probability of infection from an infected host to a susceptible vector, 0.4
b
V
◼
Probability of infection from an infected vector to a susceptible host, 0.4
b
H
◼
Mortality rate of the vector 0.25day
μ
V
-1
s
◼
Recovery rate of the host,
r0.167day
-1
s
Assumptions
Assumptions
The model, which is based on information from Nishiura (2006), makes several assumptions related to host and vector populations, transmission dynamics, biting behavior, and the natural history of infection . Let' s discuss these assumptions :
1
.Closed Population: The model assumes a closed population, meaning there is no immigration or emigration of individuals into or out of the population during the simulation. In reality, population movement and migration can impact disease dynamics.
2
.Constant Population Sizes: The model assumes constant population sizes for both the vector (mosquito) and host (human) populations. In reality, populations can change over time due to births, deaths, and other demographic factors.
3
.Homogeneous Mixing: The model assumes homogeneous mixing within each population, implying that all individuals have an equal chance of encountering and interacting with each other. This may not accurately represent real-world contact patterns, as contact rates can vary based on factors like age, location, and behavior.
4
.Constant Parameter Values: The model uses constant parameter values for parameters such as the biting rate, infection probabilities , vector mortality rate , and host recovery rate . In reality, these parameters can vary over time and across different populations.
5
.Exponential Recovery: The model assumes that infected hosts recover from the disease at a constant exponential rate. In real-world scenarios, recovery rates can vary, and the progression of the disease may not always follow exponential dynamics.
6
.Initial Prevalence: The model begins with an initial infection prevalence of 0.28% in humans and 0.057% in mosquitoes, assuming everyone else is susceptible. This assumes that these initial prevalence values are known with certainty, which may not be the case in practice.
7
.Two Serotypes: The model does not account for the presence of multiple dengue serotypes, which can complicate disease dynamics due to cross-immunity and increased risk of severe disease upon secondary infection with a different serotype.
8
.Seasonality and Climate: The model does not consider seasonality, climate effects, or variations in mosquito populations due to environmental factors, which are important in dengue transmission.
9
.Vector Control Measures: The model does not incorporate the impact of vector control measures or human behavioral changes in response to outbreaks.
10
.Evolution of the Pathogen: The model assumes a fixed pathogen with constant properties. In reality, pathogens can evolve, potentially affecting disease transmission dynamics.
In[]:=
Clear["Global`*"]
In[]:=
(*periodoftimeindays*)tmax=90;
In[]:=
(*Bitingrate*)a=1;
It represents how frequently mosquitoes bite humans, influencing the rate of potential disease transmission events .
In[]:=
(*Probabilityofinfectionfromaninfectedhosttoasusceptiblevector*)bV=0.4;
It quantifies the likelihood of a mosquito becoming infected when it bites an infected human, affecting the efficiency of disease transmission .
In[]:=
(*Probabilityofinfectionfromaninfectedvectortoasusceptiblehost*)bH=0.4;
It represents the likelihood of a susceptible human becoming infected when bitten by an infected mosquito, influencing the success of disease transmission from vectors to humans
(*Mortalityrateofthevector*)μv=0.25;
It reflects the natural death rate of mosquitoes, impacting the vector population' s life expectancy and, indirectly, the potential for disease transmission .
Recovery rate of the host
r=0.167;
It indicates how quickly infected humans recover from the disease, determining the duration of dengue infection in the human population .
Initial mosquito population
nv=20000;
Initial infected mosquitoes (0.057 % prevalence)
iv0=0.00057*nv
Out[]=
11.4
Initial human population
nh=10000;
Initial infected humans (0.28 % prevalence)
ih0=0.0028*nh
Out[]=
28.
The differential equations for the mosquito population dynamics are
eqnsvector=sv'[t]==μv*nv-*sv[t]*ih[t]-μv*sv[t],iv'[t]==*sv[t]*ih[t]-μv*iv[t],sv[0]==nv-iv0,iv[0]==iv0;
a*bV
nh
a*bV
nh
The differential equations for the human host population dynamics are :
eqnshost=sh'[t]==-*sh[t]*iv[t],ih'[t]==*sh[t]*iv[t]-r*ih[t],rh'[t]==r*ih[t],sh[0]==nh-ih0,ih[0]==ih0,rh[0]==0;
a*bH
nh
a*bH
nh
Solve the system
sol=NDSolve[{eqnsvector,eqnshost},{sv,iv,sh,ih,rh},{t,0,tmax}];
In[]:=
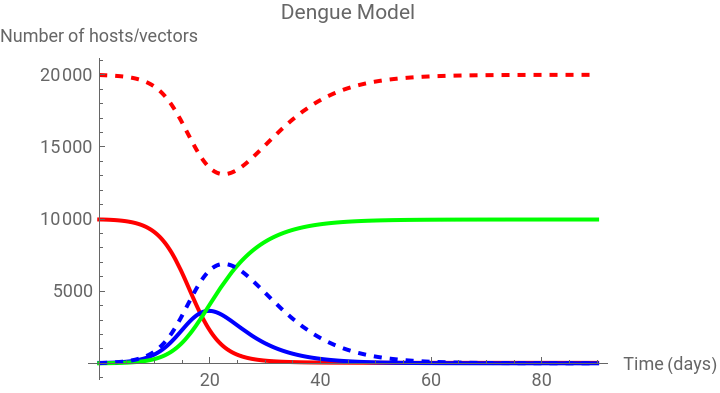
Plot[Evaluate[{sh[t],ih[t],rh[t],sv[t],iv[t]}/.sol],{t,0,90},PlotLegends->{"Susceptible Humans","Infected Humans","Recovered Humans)","Susceptible Mosquitoes","Infected Mosquitoes"},PlotStyle->{{Thick,Red},{Thick,Blue},{Thick,Green},{Dashed,Red},{Dashed,Blue},{Dashed,Green}},PlotLabel->"Dengue Model",AxesLabel->{"Time (days)","Number of hosts/vectors"}]
Out[]=


Extract the solutions
svSol=sv/.sol[[1]];ivSol=iv/.sol[[1]];shSol=sh/.sol[[1]];ihSol=ih/.sol[[1]];rhSol=rh/.sol[[1]];
Based on the plot, how do assumptions of the mosquito biting activity affect the human infection prevalence?
Based on the plot, how do assumptions of the mosquito biting activity affect the human infection prevalence?
In[]:=
Plot[{svSol[t],ivSol[t]},{t,0,tmax},PlotLegends->{"Susceptible Mosquitoes","Infected Mosquitoes"},AxesLabel->{"Time","Population"},PlotLabel->"Mosquito Population Dynamics"]
Out[]=
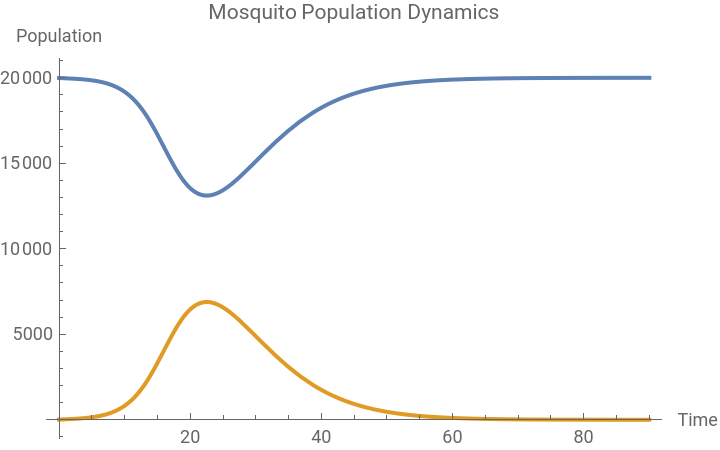


The plot of the model' s mosquito population dynamics does not directly reveal the impact of assumptions about mosquito biting activity on human infection prevalence . To assess how mosquito biting activity assumptions affect human infection prevalence, you would need to analyze the plot of human population dynamics, specifically the curve for "Infected Humans )" and consider the following :
◼
Transmission Probability from Infected Host to Vector: A higher transmission probability (bV) implies that when mosquitoes bite infected humans, they are more likely to become infected themselves. This can result in a higher prevalence of infected mosquitoes, potentially leading to increased human infection prevalence over time.
Based on the information we provided and the parameter values for the model, it does not appear to represent a scenario with an epidemic outbreak .
However, it’s important to note that the absence of an epidemic in the current model does not diminish its usefulness. This model can still be valuable for studying disease transmission dynamics, understanding how different parameters influence infection prevalence, and exploring the impact of interventions or changes in parameter values on disease spread.
However, it’s important to note that the absence of an epidemic in the current model does not diminish its usefulness. This model can still be valuable for studying disease transmission dynamics, understanding how different parameters influence infection prevalence, and exploring the impact of interventions or changes in parameter values on disease spread.
Reference
Reference
1
.Nishiura, Hiroshi (2006). Mathematical and Statistical Analyses of the Spread of Dengue. WHO Regional Office for South-East Asia. https://apps.who.int/iris/handle/10665/170261
CITE THIS NOTEBOOK
CITE THIS NOTEBOOK
A model of Dengue transmission dynamics: insights into mosquito-human interactions and disease spread
by Athanasios Paraskevopoulos
Wolfram Community, STAFF PICKS, September 16, 2023
https://community.wolfram.com/groups/-/m/t/3013572
by Athanasios Paraskevopoulos
Wolfram Community, STAFF PICKS, September 16, 2023
https://community.wolfram.com/groups/-/m/t/3013572