Correlation and Regression Explorer
Correlation and Regression Explorer

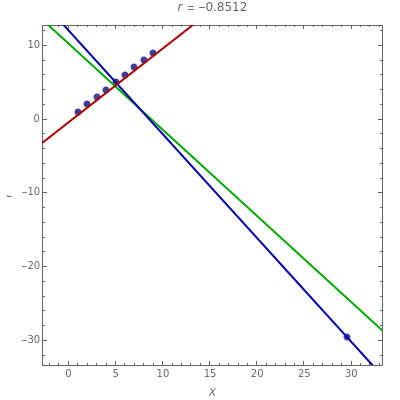
The scatter plot shown is based on an initial data configuration that was called Andrew's example in a lecture by J. W. Tukey that the author attended. Three types of regression lines are available: least squares (LS), least absolute deviation (L1), and a resistant line regression. See the Details section for more information about the regression lines. In Andrew's example, LS, L1, and RLINE all produce very different fits.
As you drag, create, or delete points, the correlation and regression line are updated.
Try moving the points to create a set that looks similar to what might be obtained from a bivariate normal with correlation . Then see if you can drag one point away from the others so it is an outlier without changing the resistant regression line very much. Notice, however, that the correlation does change. Now drag the point so the resistant regression line also changes.
ρ=0.8
Can you create data in which there is a strong association between and but ?
X
Y
r=0