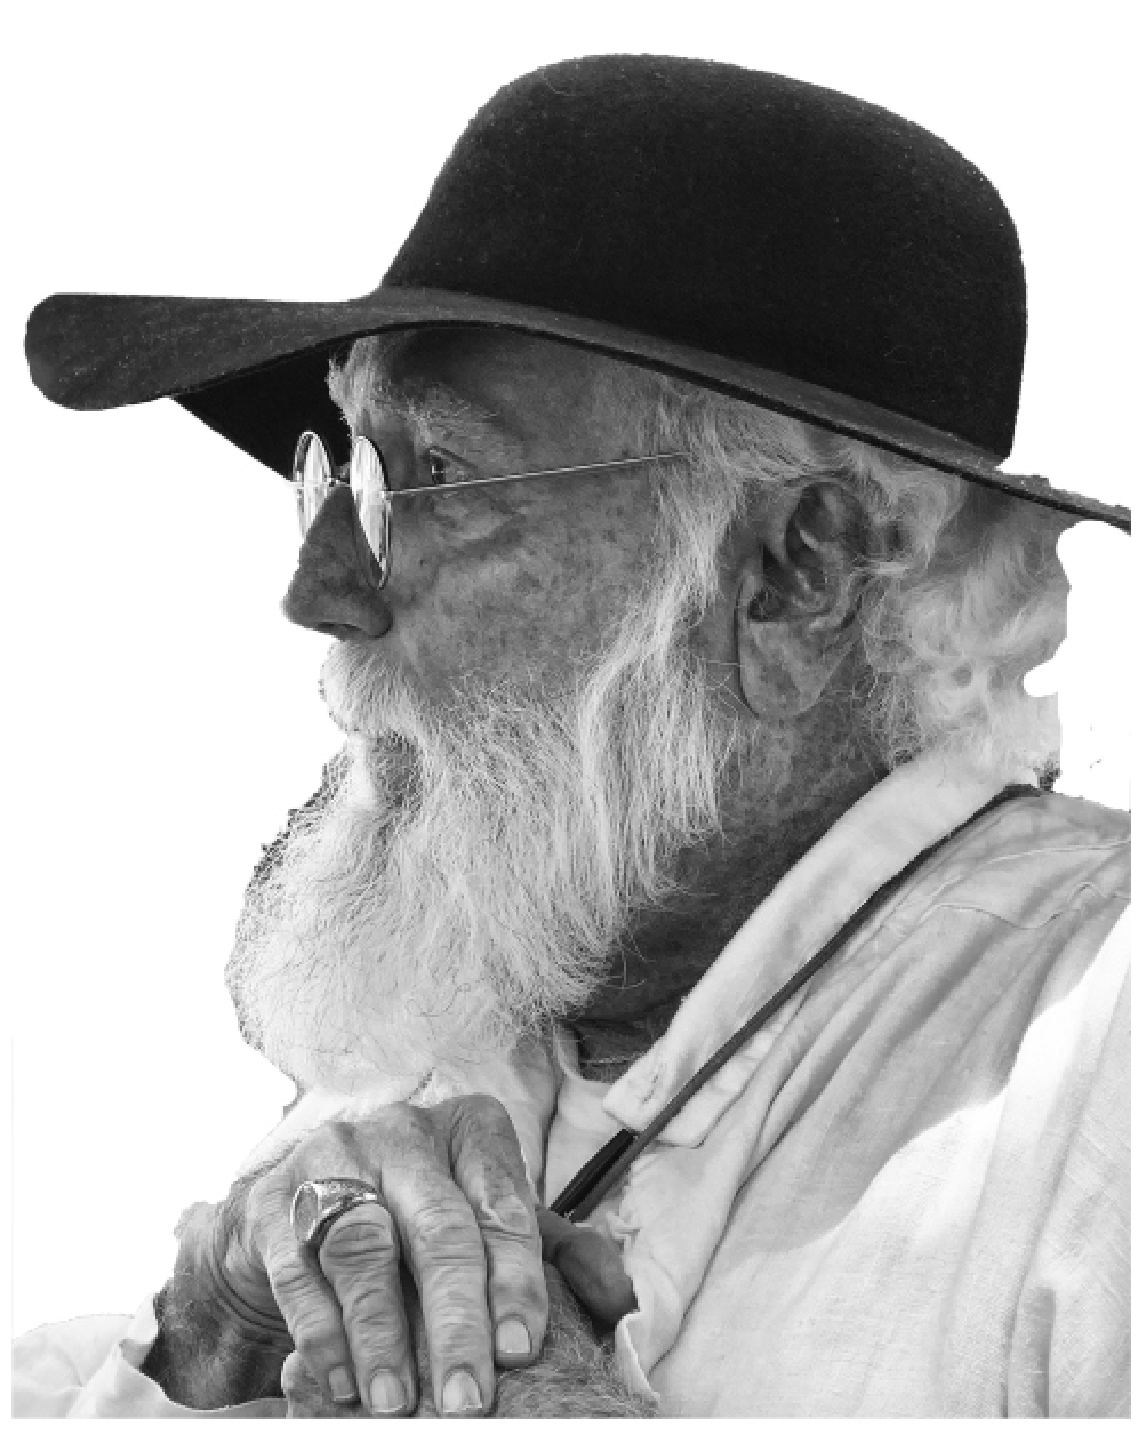
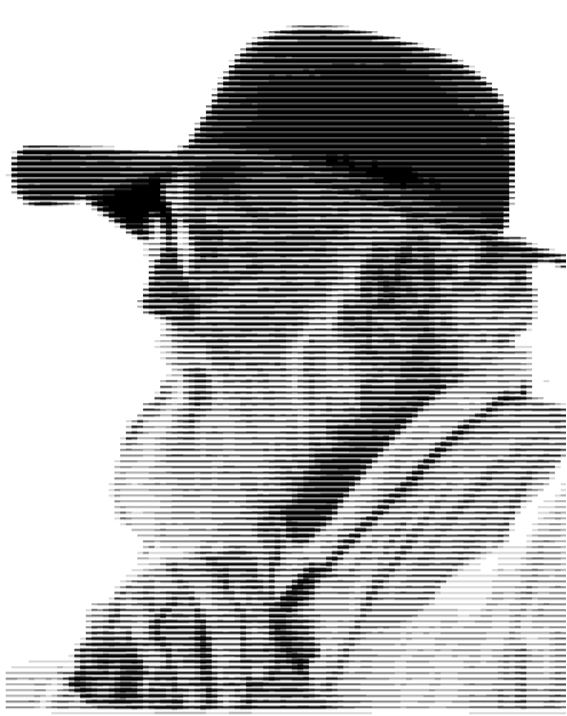
First, the program takes an image and convert it into a B&W image in a Grayscale, The ImageData for the B&W image is an 2D array with values between 0. and 1 . Then, for each 10x10 subgrid of the image. the area is replace by an subimage which is a line image representation of the average value of the 10x10 subgrid. For an average value of 0, a all white area, the replace subgrids would be all 0. For a 10x10 subgrids of 1, a black area, then, replace grid would be a grid that wold have a large horizontal place bar.
Note: Program CPU time on laptop ~ 70 sec
In[]:=
ClearAll["Global`*"]
Generate a variation of horizontal lines” ( 20 lines types in boxes)
box20x20=ConstantArray[0.,{20,20}];(*Obtaintopandbottomlinesforthelineacrossthe20x20image*)Firstele=Flatten[{11,11-Ceiling[Range[18]/2]}];Secondelem=11+Floor[(Range[18]-1)/2];rowvalues=Table[{Firstele[[i]],Secondelem[[i]]},{i,1,18}];nosimg=Dimensions[rowvalues][[1]];rowvalues[[1,1]];(*Fillinthebarsofthe20x20images*)f[ii_]:=Module[{i=ii},r1=rowvalues[[i,1]];r2=rowvalues[[i,2]];newMat=ReplaceAt[box20x20,_->1,{r1;;r2,All}];newMat]zeroimg=ArrayPlot[0*f[1],ColorFunction"Monochrome",ImageSizeTiny,FrameFalse];blackimg=ArrayPlot[0*f[1]+1,ColorFunction"Monochrome",ImageSizeTiny,FrameFalse];{zeroimg,blackimg};Lineimagesall=Table[ArrayPlot[f[i],ColorFunction"Monochrome",ImageSizeTiny,FrameFalse],{i,1,nosimg}];Lineimagesall=Table[ArrayPlot[f[i],ColorFunction"Monochrome",ImageSizeTiny,FrameFalse],{i,nosimg,1,-1}];setoflineimages=Flatten[{blackimg,Lineimagesall,zeroimg}];
Develop graphics representations for each of the above images
In[]:=
Lineimagesall[];
In[]:=
ImageAssemble[{setoflineimages[[1;;4]],setoflineimages[[5;;8]],setoflineimages[[9;;12]],setoflineimages[[13;;16]],setoflineimages[[17;;20]]}];
Input file
In[]:=
imageFile="C:\\Users\\gag00\\Desktop\\portrait500.jpg";(*inputimagefilename500x626@JuliaGary*)
In[]:=
img=ColorConvert[Import[imageFile],"Grayscale"]
Out[]=
Reduce number of pixels by averaging
In[]:=
rows=ImageDimensions[img][[1]];columns=ImageDimensions[img][[2]];{rows,columns}
Out[]=
{500,626}
In[]:=
pixels=ImageData[img];
In[]:=
ii=300;jj=254;Image[pixels[[ii;;ii+10,jj;;jj+10]]];
In[]:=
rastersize=5;(*10*)
In[]:=
Mean[Flatten[pixels[[ii;;ii+rastersize,jj;;jj+rastersize]]]]
Out[]=
0.674619
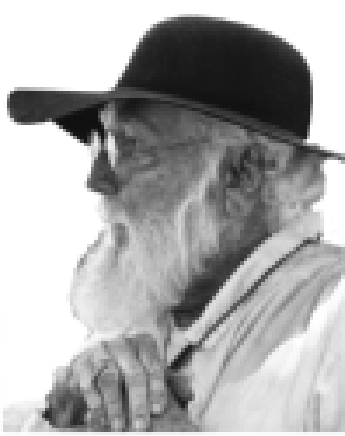
rasterized=Table[Mean[Flatten[pixels[[i;;i+rastersize,j;;j+rastersize]]]],{i,1,columns-rastersize,rastersize},{j,1,rows-rastersize,rastersize}];
In[]:=
Dimensions[rasterized]
Out[]=
{125,99}
In[]:=
{Min[rasterized].Max[rasterized]}
Out[]=
{0.0626362.1.}
In[]:=
Value20=IntegerPart[20.rasterized+.45];
In[]:=
Image[rasterized]
Out[]=
Display Line Image
ImageAssemble[Table[Table[setoflineimages[[Value20[[i,j]]]],{j,1,99}],{i,1,125}]]
Out[]=
In[]:=
TimeUsed[]
Out[]=
70.391
CITE THIS NOTEBOOK
CITE THIS NOTEBOOK
Generating images using only horizontal lines
by Gilmer Gary
Wolfram Community, STAFF PICKS, August 6, 2026
https://community.wolfram.com/groups/-/m/t/3775425
by Gilmer Gary
Wolfram Community, STAFF PICKS, August 6, 2026
https://community.wolfram.com/groups/-/m/t/3775425