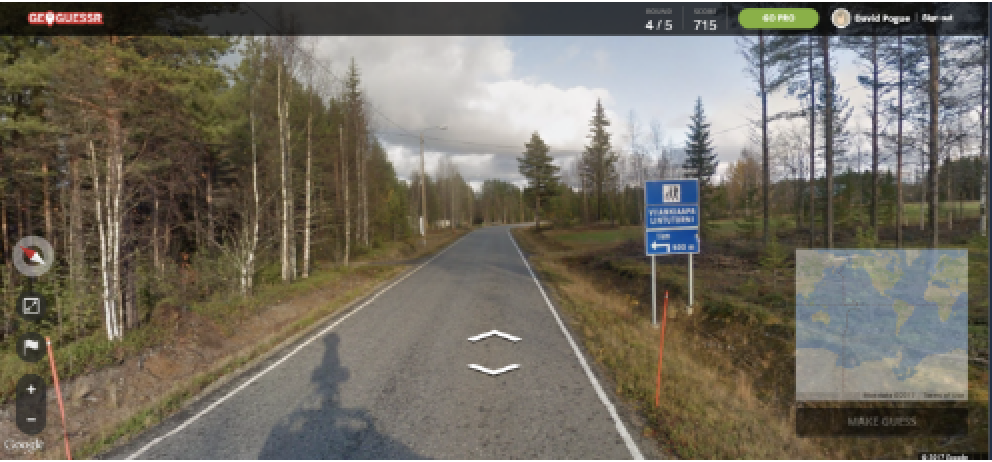
GeoGessur is an online challenge where players are given a Google Maps "Street View" image, and must find the location on a world map under a time constraint. At Wolfram Summer School 22', I was able to meet one of the Neural Network developers and talked to her about the Wolfram Neural Network which can identify a location based on an image. My brother is a fairly competitive GeoGessur player, and therefore, we wanted to see who would perform better, the Neural Network, or him, a real human player. We also wanted to see what factors made the NN so successful (albeit under several constraints)Above: the UI for GeoGessur. Players are given 5 "Street Views" and must determine the locations to the the best of their abilities. This Neural Network was ultimately packaged in Wolfram Cloud Object. Note: this is an educational and fun project, and does not promote or intend to automate or disrupt gameplay, or collect user-data or streetviews in any way. This project seeks to highlight the usefulness of a WL capability.
Using the ResNet-101 GeoLocation Neural Network
Using the ResNet-101 GeoLocation Neural Network
I wanted to create a portal where a player can easily give Wolfram Language an image, and see what country it would think the picture was from. We first needed to use a neural network that we could give an image. I choose to use the RestNet-101 from the Wolfram Language documentation. Below is a picture of my dad and me skiing in Norway, here is the output it gives:
NetModel["ResNet-101 Trained on YFCC100m Geotagged Data"]

Out[]=
GeoPosition[{49.3779,-123.188}]
The NetModel outputs a GeoPosition, which we can graph using a GeoListPlot.
GeoListPlot[GeoPosition[{49.3778885417,-123.188009666}],GeoZoomLevel2];
The neural network outputs British Columbia, which makes sense heuristically. Now, we may graph all of the other guesses the NN had.
In[]:=
GeoBubbleChartNetModel["ResNet-101 Trained on YFCC100m Geotagged Data"]
,{"TopProbabilities",20},ChartLabelsRange[20],ImageSizeLarge

In fact, the actual location, Norway is the 9th ranked probability, with a probability of
NetModel["ResNet-101 Trained on YFCC100m Geotagged Data"]
,{"TopProbabilities",20}[[9,2]]

Out[]=
0.0236089
Or a 2.4% chance, as opposed to a 13% chance for the best guess.
We want to have the user (in this case my brother) play the GeoGessur game, and have the user take a picture of each of 5 images given in GeoGessur 3 times, for a total of 3 rounds of five guesses, then have a UI to use these pictures to get NN output, to compare outcomes.
Integrating the Model into a UI
Integrating the Model into a UI
We can deploy the model by making a user-interface via a Cloud Object.
x=CloudDeploy[FormFunction[{"photo""Image"},GeoPosition[NetModel["ResNet-101 Trained on YFCC100m Geotagged Data"][#photo]]&]]SetOptions[CloudObject[x],Permissions"Private"];
Out[]=
◼
Above: the cloud object should have the following form.
I sent this UI to my brother to have him compare his GeoGessur gameplay.
Performance Comparison
Performance Comparison
My brother played three rounds versus the NN (these are displayed below). Throughout three games given the rules that the human player was not allowed to pan or zoom, my brother achieved the following results: 9 - AI, 6 - Him. After the first game: it was 2-3, then 5-5, and 9-6. My brother was given the following scores out of 10,000 each, by GeoGessur. Using these scores as a metric for his performance, we can see he performed similarly on the first two games, with a slightly lower score on the last game. This correlated with a strong outcome for the NN in the last round.
scores={9800,9300,3300};N[{Mean[scores],StandardDeviation[scores]}]
Out[]=
{7466.67,3617.09}
It is suprising the NN was able to outperform a human player. Therefore, it is likely the NN is able to use image features that are less accessible to human players.
Display Games:
Display Games:
Image Features Influencing NN Output
Image Features Influencing NN Output
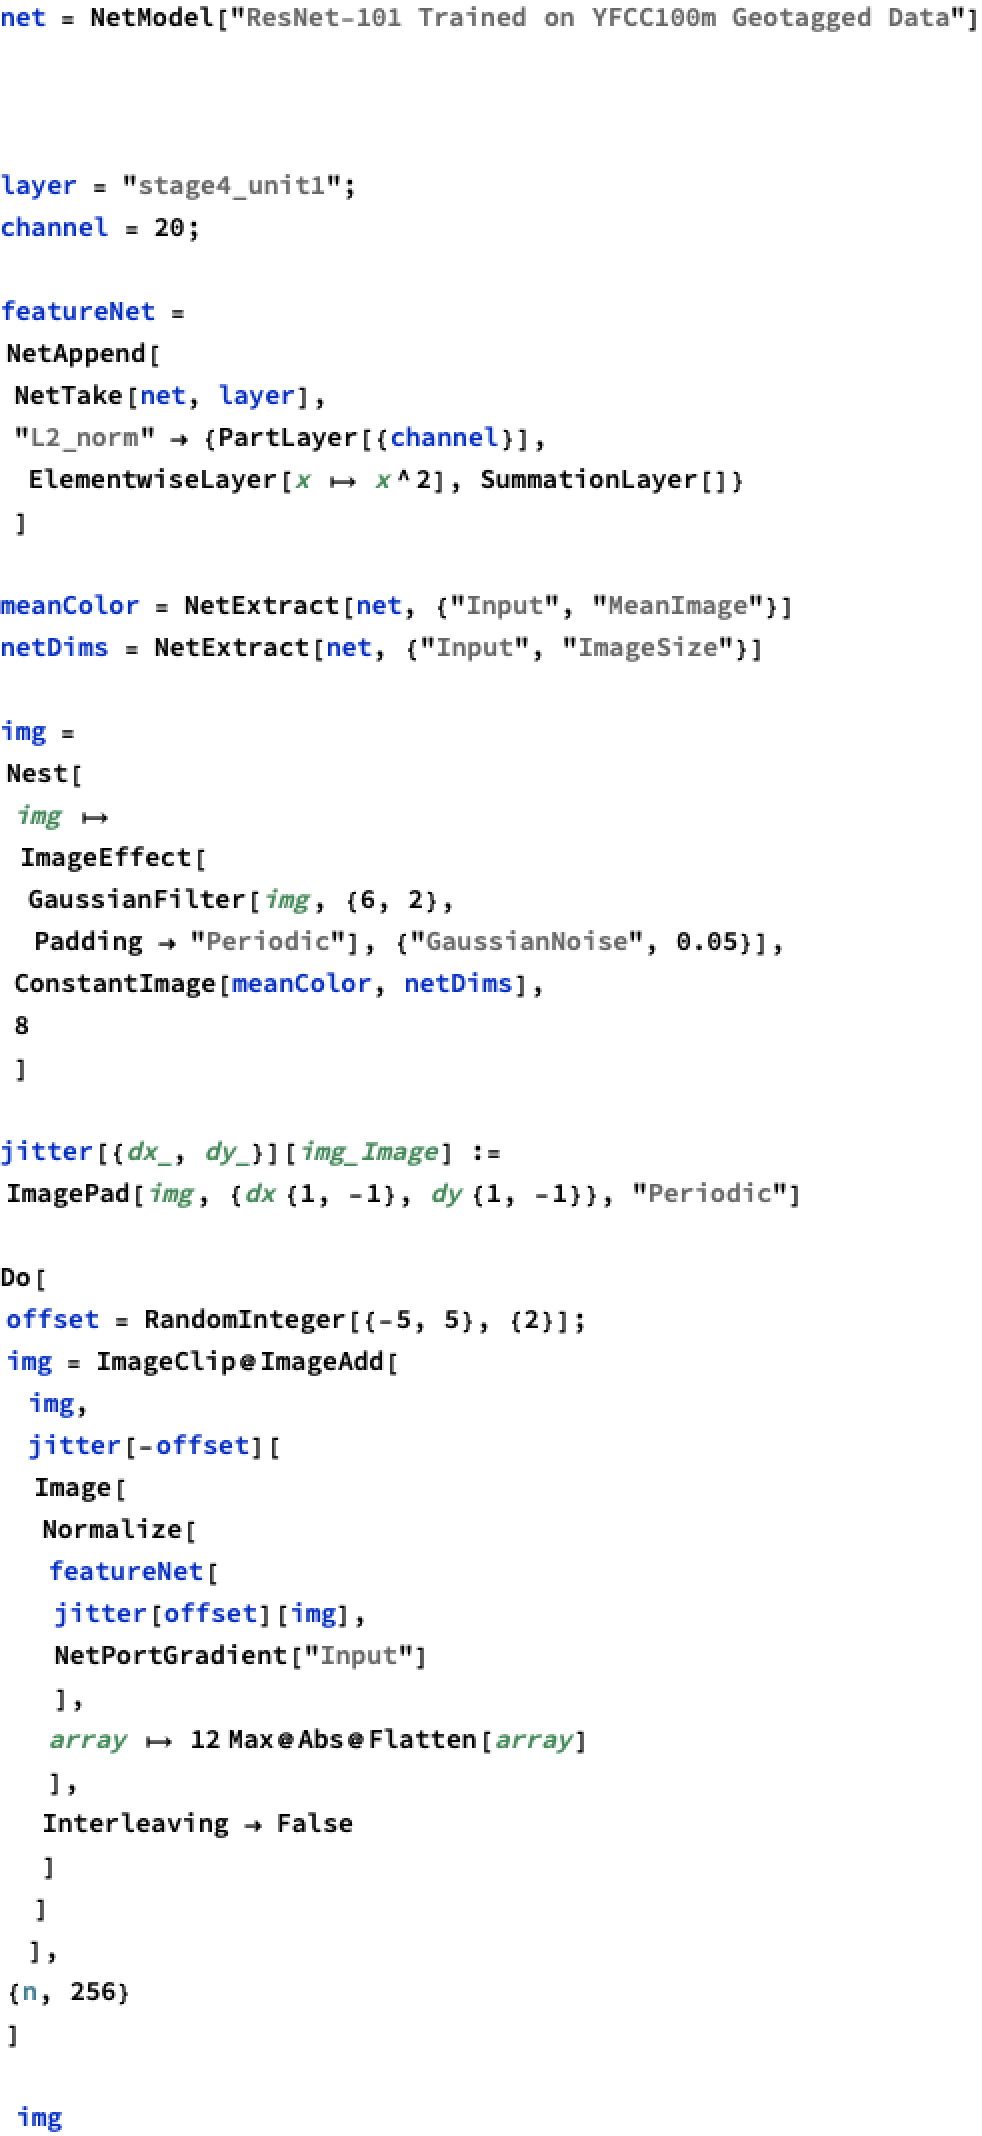
We can gain a deeper understanding of the factors influencing the NN output by generating a "random" image, and perturbing the pixel values in this image to maximise the sum of squares of the values of nodes in given Neural Layer as a "metric" of what the NN wants to see. I learned copied the code in the WL documentation here
For example, after one appends this "L2 norm" to the stage2_unit 1 channel 10 layer, we obtain the following network. The output layer collects the sum of squares of the previous layer.
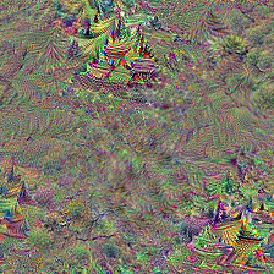
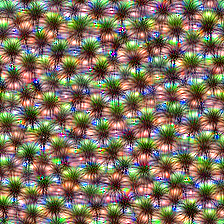
We strongly suspected tree type is taken into account in the Neural Network, as that is a feature of these images that a machine would be better than humans at keeping track of. Incidentally, if we do look at layer = "stage4_unit1"; channel = 20; i.e the stage4_unit1 shows the following. The image shows distinctly tree looking shapes, in the outside frame of the image. Therefore, it is extremely likely that tree type is a strongly considered in the NN. In the stage3unit1 layer channel 10, there is also the distinct feature which looks like shrubbery, so it is likely that general environmental characteristics are strongly taken into account by the NN.
◼
Above: distinct tree shapes in the optimal activation of stage4unit1 layer channel 20, indicating tree type is considered strongly in the NN
◼
Above: shrubbery-shapes in the optimal activation of stage3unit1 layer channel 10, showing the NN may take environmental characteristics into account
Conclusion
Conclusion
The ResNet-101 Geolocation NN offered in the Wolfram NN Repository offers a unique opportunity to compare GeoGessur performance between a human and a machine player. Net Surgery and "Image Perturbation" offer a human better insight onto features which activate NN layers optimally. Using these features, it seems this particular NN seems to rely strongly on wildlife/environmental features. This shows a major weakness of the NN, that it seems to rely on simple, readily accessible features to make Geolocation decisions, instead of more heuristic clues, such as building type/car type, etc. This NN will not achieve optimal performance also because its selections are based off of Yahoo Images data, which contains different information than current Google Maps imagery.Not all places have equal imagery coverage from Google Maps street view, so an optimal NN must skew its selections to the available street data.
Appendix
Appendix
Graph Generation Code
Graph Generation Code

Image Perturbation Code
Image Perturbation Code