Effect of pressure ratio on membrane area requirement
Authors: Housam Binous and Ahmed Bellagi
Effect of pressure ratio on membrane area requirement
Authors: Housam Binous and Ahmed Bellagi
Authors: Housam Binous and Ahmed Bellagi
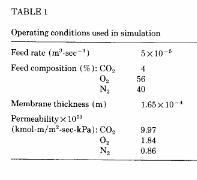
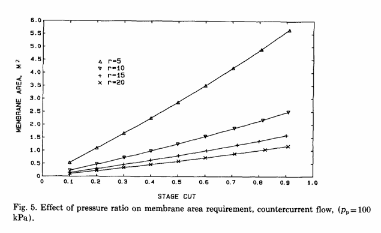
Various flow patterns for gas permeation of a multicomponent system are studied in Ref. 1. The feed is composed of CO2, O2, and N2, with an initial CO2 content of 4 mole % (see Table 1 of Ref. 1). The CO2 removal from closed or semi-closed life sustaining environments is considered. The objective is to achieve a lean stream content of CO2 of about 0.5 mole % in the breathing gas. Figure 5 of Ref. 1 depicts the effect of pressure ratio on membrane area requirement for the counter-current flow pattern.Here, we successfully reproduce Fig. 5 of Ref. 1 using the methodology described in detail in Ref. 2.References:[1] K. Li, D.R. Acharya, R. Hughes, Mathematical modelling of multicomponent membrane permeators, Journal of Membrane Science, Volume 52, Issue 2, 1990, Pages 205-219, https://doi.org/10.1016/S0376-7388(00)80486-X .[2] H . Binous, U . Zahid and A . Bellagi, Modeling for Multi - component Gas Permeation with Orthogonal Collocation and Arc - Length Continuation, Chemistry Africa (2024) . https://doi.org/10.1007/s42250-024-01167-y
r=20
r=20
In[]:=
functions={xA[1]xA[1][s],xB[1]xB[1][s],xA[2]xA[2][s],yA[2]yA[2][s],xB[2]xB[2][s],yB[2]yB[2][s],q[2]q[2][s],xA[3]xA[3][s],yA[3]yA[3][s],xB[3]xB[3][s],yB[3]yB[3][s],q[3]q[3][s],xA[4]xA[4][s],yA[4]yA[4][s],xB[4]xB[4][s],yB[4]yB[4][s],q[4]q[4][s],xA[5]xA[5][s],yA[5]yA[5][s],xB[5]xB[5][s],yB[5]yB[5][s],q[5]q[5][s],xA[6]xA[6][s],yA[6]yA[6][s],xB[6]xB[6][s],yB[6]yB[6][s],q[6]q[6][s],xA[7]xA[7][s],yA[7]yA[7][s],xB[7]xB[7][s],yB[7]yB[7][s],q[7]q[7][s],xA[8]xA[8][s],yA[8]yA[8][s],xB[8]xB[8][s],yB[8]yB[8][s],q[8]q[8][s],xA[9]xA[9][s],yA[9]yA[9][s],xB[9]xB[9][s],yB[9]yB[9][s],q[9]q[9][s],xA[10]xA[10][s],yA[10]yA[10][s],xB[10]xB[10][s],yB[10]yB[10][s],q[10]q[10][s],xA[11]xA[11][s],yA[11]yA[11][s],xB[11]xB[11][s],yB[11]yB[11][s],q[11]q[11][s],xA[12]xA[12][s],yA[12]yA[12][s],xB[12]xB[12][s],yB[12]yB[12][s],q[12]q[12][s],xA[13]xA[13][s],yA[13]yA[13][s],xB[13]xB[13][s],yB[13]yB[13][s],q[13]q[13][s],xA[14]xA[14][s],yA[14]yA[14][s],xB[14]xB[14][s],yB[14]yB[14][s],q[14]q[14][s],xA[15]xA[15][s],yA[15]yA[15][s],xB[15]xB[15][s],yB[15]yB[15][s],q[15]q[15][s],xA[16]xA[16][s],yA[16]yA[16][s],xB[16]xB[16][s],yB[16]yB[16][s],q[16]q[16][s],xA[17]xA[17][s],yA[17]yA[17][s],xB[17]xB[17][s],yB[17]yB[17][s],q[17]q[17][s],xA[18]xA[18][s],yA[18]yA[18][s],xB[18]xB[18][s],yB[18]yB[18][s],q[18]q[18][s],xA[19]xA[19][s],yA[19]yA[19][s],xB[19]xB[19][s],yB[19]yB[19][s],q[19]q[19][s],xA[20]xA[20][s],xB[20]xB[20][s],yB[20]yB[20][s],yA[20]yA[20][s],q[20]q[20][s],thetatheta[s],yA[21]yA[21][s],yB[21]yB[21][s],stst[s]};
In[]:=
Out[]=
{xA[1]0.0202089,xB[1]0.548026,xA[2]0.0202972,xB[2]0.548135,xA[3]0.020562,xB[3]0.548455,xA[4]0.0210031,xB[4]0.548972,xA[5]0.0216194,xB[5]0.549662,xA[6]0.0224085,xB[6]0.550495,xA[7]0.0233658,xB[7]0.551434,xA[8]0.0244832,xB[8]0.552441,xA[9]0.0257479,xB[9]0.553474,xA[10]0.0271416,xB[10]0.554498,xA[11]0.0286391,xB[11]0.555478,xA[12]0.0302084,xB[12]0.556386,xA[13]0.0318103,xB[13]0.557202,xA[14]0.0333993,xB[14]0.557912,xA[15]0.0349253,xB[15]0.55851,xA[16]0.0363355,xB[16]0.558997,xA[17]0.0375775,xB[17]0.559377,xA[18]0.0386021,xB[18]0.559659,xA[19]0.0393672,xB[19]0.559851,xA[20]0.03984,xB[20]0.559963,yA[2]0.103138,yB[2]0.649845,yA[3]0.103835,yB[3]0.649519,yA[4]0.104987,yB[4]0.648976,yA[5]0.106583,yB[5]0.648216,yA[6]0.108601,yB[6]0.647241,yA[7]0.111014,yB[7]0.646055,yA[8]0.113785,yB[8]0.644669,yA[9]0.116866,yB[9]0.643099,yA[10]0.120197,yB[10]0.64137,yA[11]0.123707,yB[11]0.639514,yA[12]0.127316,yB[12]0.637573,yA[13]0.13093,yB[13]0.635598,yA[14]0.134451,yB[14]0.633647,yA[15]0.137776,yB[15]0.63178,yA[16]0.140803,yB[16]0.630062,yA[17]0.143435,yB[17]0.628555,yA[18]0.145582,yB[18]0.627315,yA[19]0.147173,yB[19]0.626393,yA[20]0.14815,yB[20]0.625824,yA[21]0.14848,yB[21]0.625631,q[2]0.84661,q[3]0.849295,q[4]0.853706,q[5]0.859748,q[6]0.867291,q[7]0.87617,q[8]0.886188,q[9]0.897119,q[10]0.908715,q[11]0.920702,q[12]0.932795,q[13]0.944694,q[14]0.956101,q[15]0.966717,q[16]0.97626,q[17]0.984469,q[18]0.991112,q[19]0.996001,q[20]0.998993,theta0.154291,0.102905,0.649953,0.247142}
y
PAi
y
PBi
y
PCi
In[]:=
factor=1/20001.6410^-41/9.9710^13510^-51/25.5
Out[]=
0.161268
In[]:=
xA[Np+1]=.;xB[Np+1]=.;yA[1]=.;yB[1]=.;q[Np+1]=.;q[1]=.;xA[Np+1][s_]:=;xB[Np+1][s_]:=;yA[1][s_]:=;yB[1][s_]:=;q[Np+1][s_]:=;q[1][s_]:=(1-theta[s]);init=Join[Flatten[Table[{xA[i][0](xA[i]/.sol),yA[i][0](yA[i]/.sol),xB[i][0](xB[i]/.sol),yB[i][0](yB[i]/.sol)},{i,2,Np}],1],Flatten[Table[q[i][0](q[i]/.sol),{i,2,Np}],1],{xA[1][0](xA[1]/.sol),xB[1][0](xB[1]/.sol),yA[Np+1][0](yA[Np+1]/.sol),yB[Np+1][0](yB[Np+1]/.sol),[0](/.sol),[0](/.sol),[0](/.sol),theta[0](theta/.sol),st[0]1}];initdev=Join[Flatten[Table[{xA[i]'[0]-0.1,yA[i]'[0]-0.1,xB[i]'[0]0.1,yB[i]'[0]0.1},{i,2,Np}],1],Flatten[Table[{q[i]'[0]-0.1},{i,2,Np}],1],{theta'[0]-0.1,st'[0]-1,'[0]-0.1,'[0]-0.1,'[0]-0.1,xA[1]'[0]-0.1,xB[1]'[0]0.1,yA[Np+1]'[0]-0.1,yB[Np+1]'[0]0.1}];aux=Sum[xA[i]'[s]^2+yA[i]'[s]^2+xB[i]'[s]^2+yB[i]'[s]^2,{i,2,Np}]+xA[1]'[s]^2+xB[1]'[s]^2+Sum[q[i]'[s]^2,{i,2,Np}]+theta'[s]^2+st'[s]^2+'[s]^2+'[s]^2+'[s]^21;unknown1=Join[Flatten[Table[{xA[i],yA[i],xB[i],yB[i]},{i,2,Np}],1],Flatten[Table[q[i],{i,2,Np}],1],{theta,st,xA[1],xB[1],,,,yA[Np+1],yB[Np+1]}];SYS=Join[sys/.functions/.[s]/.[s]/.[s],{aux},init,initdev];SOL=Quiet@NDSolve[SYS,unknown1,{s,-10,10^5},AccuracyGoal5];p1=ParametricPlot[Evaluate[{theta[s],st[s]factor}/.SOL[[1]]],{s,-8.12,1000},PlotRange{{0,1.0},{0.0,6.0}},FrameTrue,GridLinesAutomatic,AspectRatio1,PlotStyle{Green,Thick,Dashed},FrameTrue,FrameLabel{Style["stage cut",16],Style["Membrane Area in m2",16]},PlotLegends->LineLegend[{Green,Blue,Red,Brown,Magenta},{"r=20","r=15","r=10","r=5"}]];
x
fA
x
fB
y
PAi
y
PBi
q
f
q
f
y
PAi
y
PAi
y
PBi
y
PBi
y
PCi
y
PCi
y
PAi
y
PBi
y
PCi
y
PAi
y
PBi
y
PCi
y
PAi
y
PBi
y
PCi
y
PAi
y
PAi
y
PBi
y
PBi
y
PCi
y
PCi
r=15
r=15
In[]:=
p
l
p
h
y
PAi
y
PBi
p
l
p
h
y
PAi
p
l
p
h
y
PBi
y
PAi
y
PCi
p
l
p
h
y
PAi
p
l
p
h
y
PCi
y
PAi
y
PBi
y
PCi
q
P
q
f
q
f
p
l
p
h
p
l
p
h
p
l
p
h
p
l
p
h
p
l
p
h
p
l
p
h
p
l
p
h
p
l
p
h
p
l
p
h
p
l
p
h
p
l
p
h
x
fA
x
fB
y
PAi
y
PBi
q
f
q
f
q
f
y
PAi
y
PBi
y
PCi
Out[]=
{xA[1]0.0214951,xB[1]0.548065,xA[2]0.0215793,xB[2]0.54817,xA[3]0.0218317,xB[3]0.548479,xA[4]0.0222515,xB[4]0.54898,xA[5]0.0228374,xB[5]0.54965,xA[6]0.0235862,xB[6]0.55046,xA[7]0.0244925,xB[7]0.551375,xA[8]0.0255478,xB[8]0.552358,xA[9]0.0267391,xB[9]0.553373,xA[10]0.0280484,xB[10]0.554383,xA[11]0.0294515,xB[11]0.555355,xA[12]0.0309181,xB[12]0.556262,xA[13]0.0324115,xB[13]0.557084,xA[14]0.0338896,xB[14]0.557806,xA[15]0.0353062,xB[15]0.558422,xA[16]0.0366131,xB[16]0.558928,xA[17]0.0377624,xB[17]0.559329,xA[18]0.0387095,xB[18]0.55963,xA[19]0.039416,xB[19]0.559838,xA[20]0.0398524,xB[20]0.55996,yA[2]0.102474,yB[2]0.648939,yA[3]0.10312,yB[3]0.648647,yA[4]0.104189,yB[4]0.648161,yA[5]0.105668,yB[5]0.64748,yA[6]0.107537,yB[6]0.646605,yA[7]0.109771,yB[7]0.645543,yA[8]0.112332,yB[8]0.644301,yA[9]0.115178,yB[9]0.642895,yA[10]0.118252,yB[10]0.641346,yA[11]0.121488,yB[11]0.639683,yA[12]0.124812,yB[12]0.637945,yA[13]0.128138,yB[13]0.636176,yA[14]0.131376,yB[14]0.634428,yA[15]0.134432,yB[15]0.632756,yA[16]0.137213,yB[16]0.631216,yA[17]0.139629,yB[17]0.629866,yA[18]0.141601,yB[18]0.628755,yA[19]0.143061,yB[19]0.627928,yA[20]0.143958,yB[20]0.627418,yA[21]0.14426,yB[21]0.627246,q[2]0.85015,q[3]0.852782,q[4]0.857106,q[5]0.863029,q[6]0.87042,q[7]0.879117,q[8]0.888925,q[9]0.899624,q[10]0.910965,q[11]0.922683,q[12]0.934496,q[13]0.946114,q[14]0.957242,q[15]0.967593,q[16]0.976892,q[17]0.984886,q[18]0.991353,q[19]0.99611,q[20]0.99902,theta0.150734,0.102257,0.649036,0.248706}
y
PAi
y
PBi
y
PCi
r=10
r=10
r=5
r=5
Comparison with Figure 5 of Li et al .
Comparison with Figure 5 of Li et al .