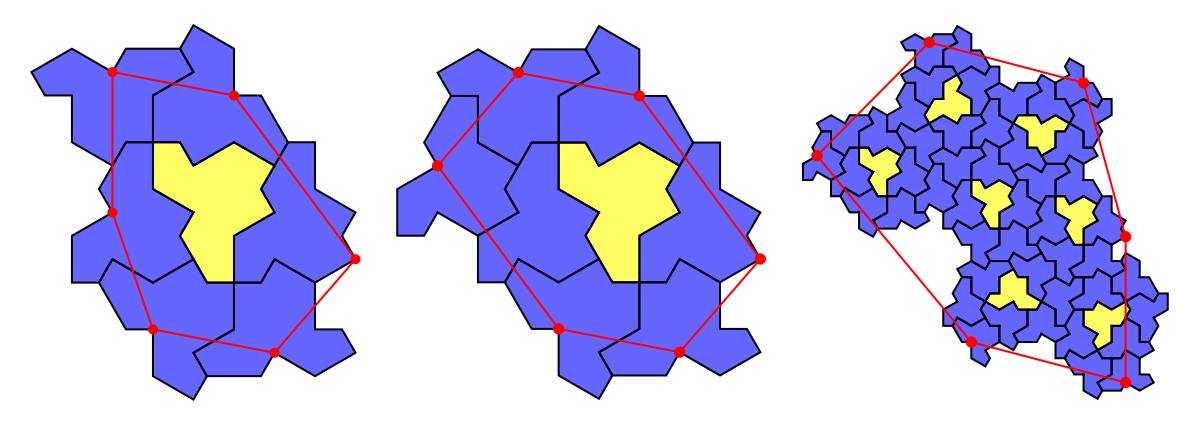
Merge H7 and H8 to substitute.
Merge H7 and H8 to substitute.
Since there are a difference between how do we define H7 - which tile should we remove for some reason. Here I tried to avoid this problem, by merging the cluster in the middle together, that is merging middle H7 and H8 together to use it as a whole to substitute.
In[]:=
H78=With[{t1=H7Tiling,t2=placeTiling[H7Tiling["controlPoints"][[4]],0,H8Tiling]},<|"code"->Join[t1["code"],t2["code"]],"controlPoints"->Join[t1["controlPoints"][[;;3]],t2["controlPoints"][[2;;6]],t1["controlPoints"][[5;;]]]|>];
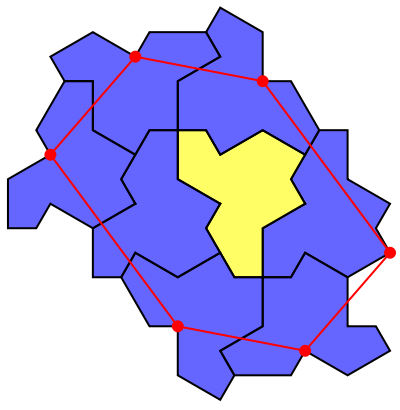
The following on the left-hand side is the cluster after merging H7 and H8. You can see it as a H8 on the left and an original H7 on the right, or a alternative H7 one the left and a H8 on the right. But now, as they have been merged, there is no H7 and H8 but only “H15”. On the right-hand side is a normal H8.
Out[]=
H15 (H7 and H8 merged) |
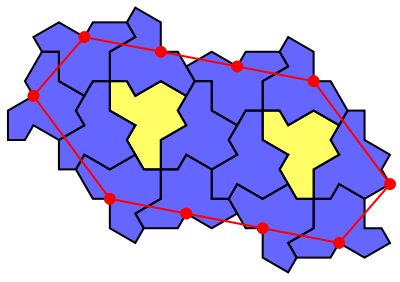

H8 |
◼
SubstitutionFunction(Code)
Result
Result
res=Reap[NestList[Values[substituteH78Merged[#[[1]],#[[2]]]]&,{H78,H8Tiling},2]];
In[]:=
Riffle[Map[depictControlPoints,res[[1]],{2}],Table[Table[Style["↓",Red,Bold,48],2],2]]//Grid
Out[]=
↓ | ↓ |
↓ | ↓ |
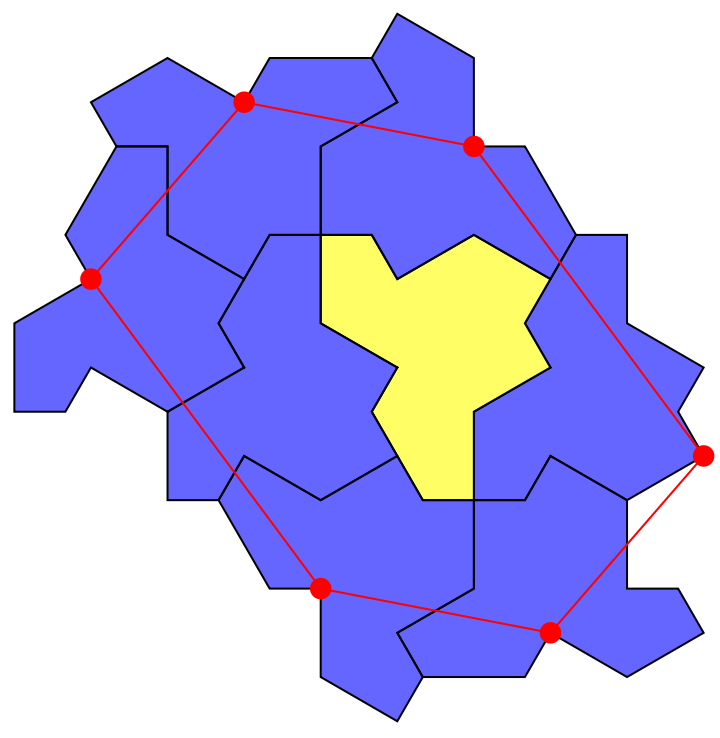
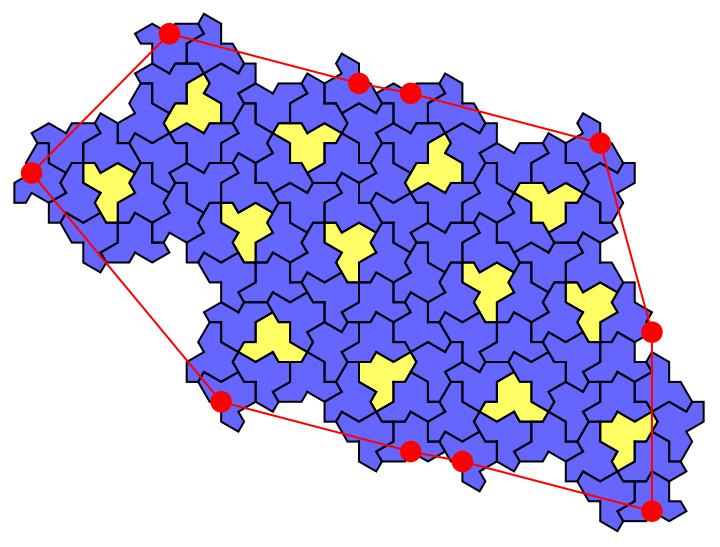
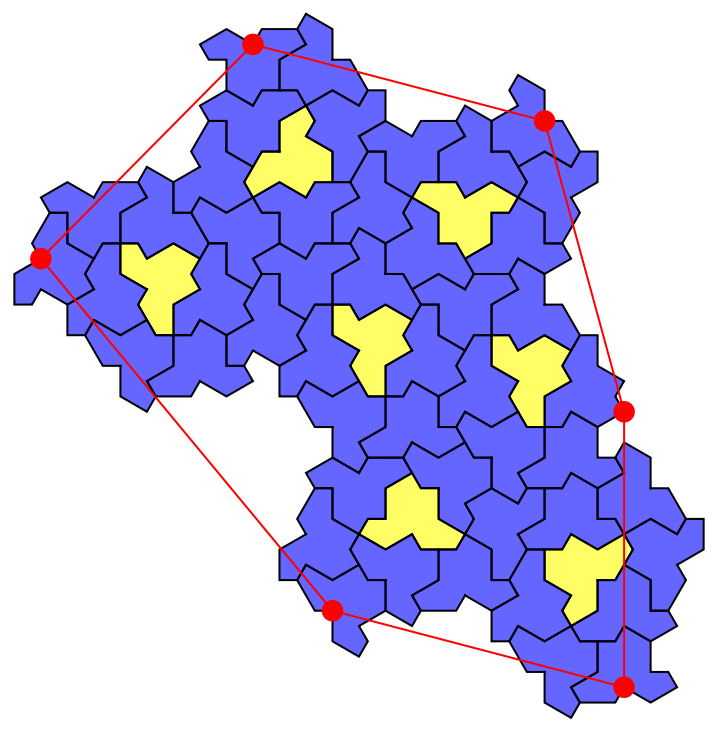
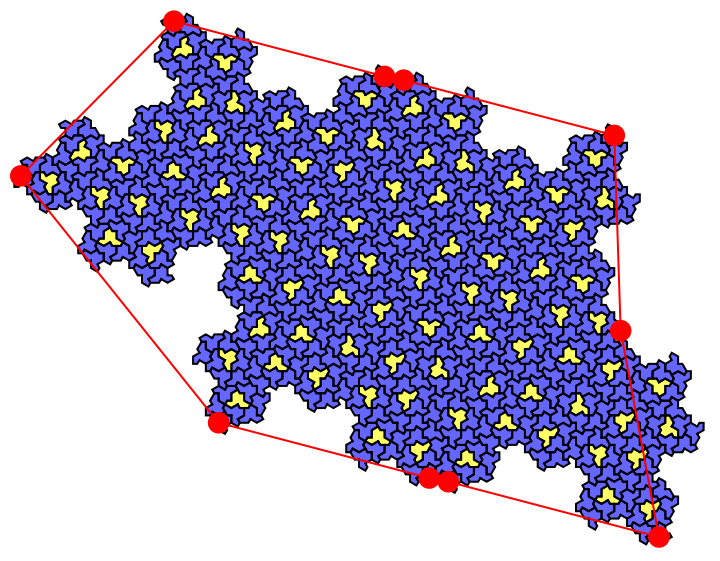
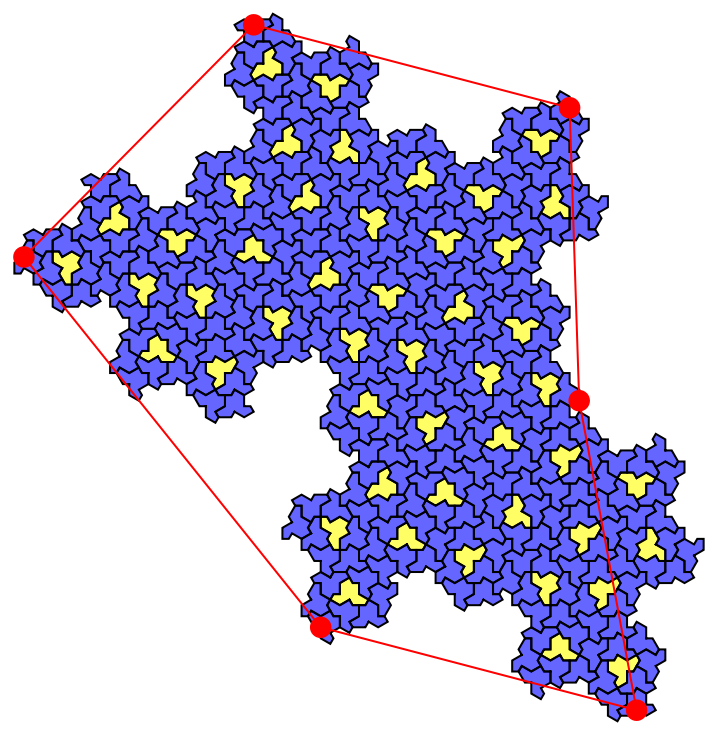
How they fir together
How they fir together
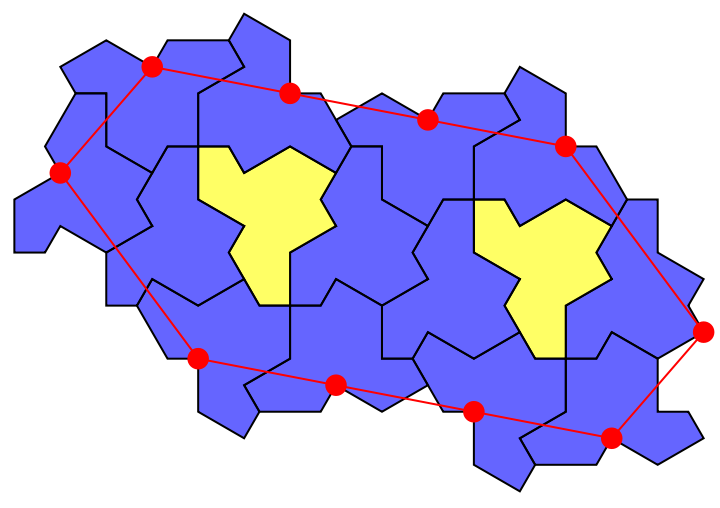
The idea to construct is basically the same as before. Only some modification on control points and tiling clusters chosen. Here is a figure showing how these points fit to each other:
In[]:=
Show[depictControlPoints/@res[[2,1,1]]]
Out[]=
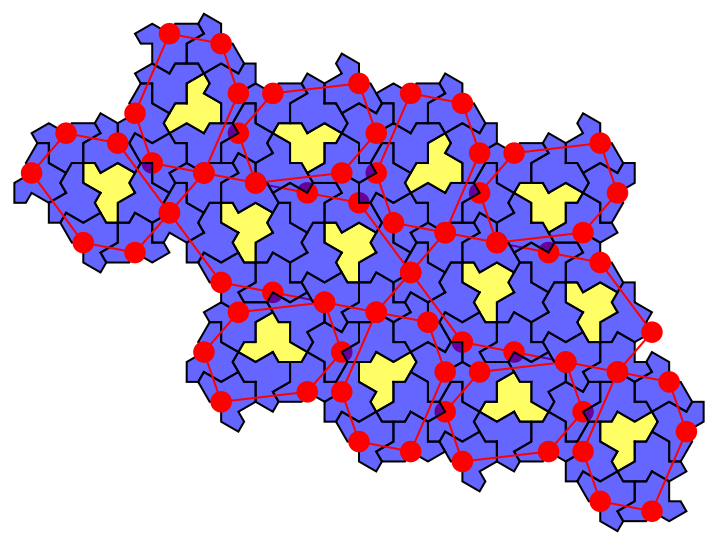
For this figure, we can see the rotation of yellow tiles to know the rotation of its whole tile. An interesting thing is, there are 5 translated clusters lining up in the middle. And the first and third row are some sort of symmetric about the central “line”. From left to right to number 1 to 4, the top row 1 corresponds to the bottom row 4, top 2 to bottom 3, top 3 to bottom 2 and top 4 to bottom 1. In fact, this property is also shown in H8/H7, and original super-tiles. Just look at the parts on the top and bottom:
In[]:=
depictControlPoints/@{H7Tiling,H8Tiling,res[[1,2,2]]}//GraphicsRow
Out[]=