Agent-Based Simulation of Half-Duplex Ethernet--original 1976 Ethernet specification
Agent-Based Simulation of Half-Duplex Ethernet--original 1976 Ethernet specification

Orchestrating an Irreversible, Real-World Transaction
This image details the meticulous process for a time-sensitive and irreversible transaction: the filing of a Section 83(b) election with the IRS. While seemingly an administrative task, the procedure is a physical manifestation of the same principles that underpin our approach to distributed systems. Each document—the Election Form, the Cover Letter, the Stock Option Agreement—can be viewed as a state-bearing token. The ordering of these tokens is not arbitrary; it is a precisely defined sequence designed to ensure the transaction is accepted and formally recorded by an external entity.
The requirement for a “USPS Certified Mail with Return Receipt” serves as the physical layer’s protocol for a verifiable, end-to-end handshake. This isn’t merely a “fire and forget” transmission; the return receipt provides what our own protocols demand: definitive, systemic knowledge that the transaction was successfully delivered. It eliminates the ambiguity that would otherwise require timeouts or follow-up inquiries to determine the outcome. This process of ordering, transmission, and verification demonstrates how the core principles of reliable, sequential coordination are essential for correctness, whether the medium is the Ether or the postal service.
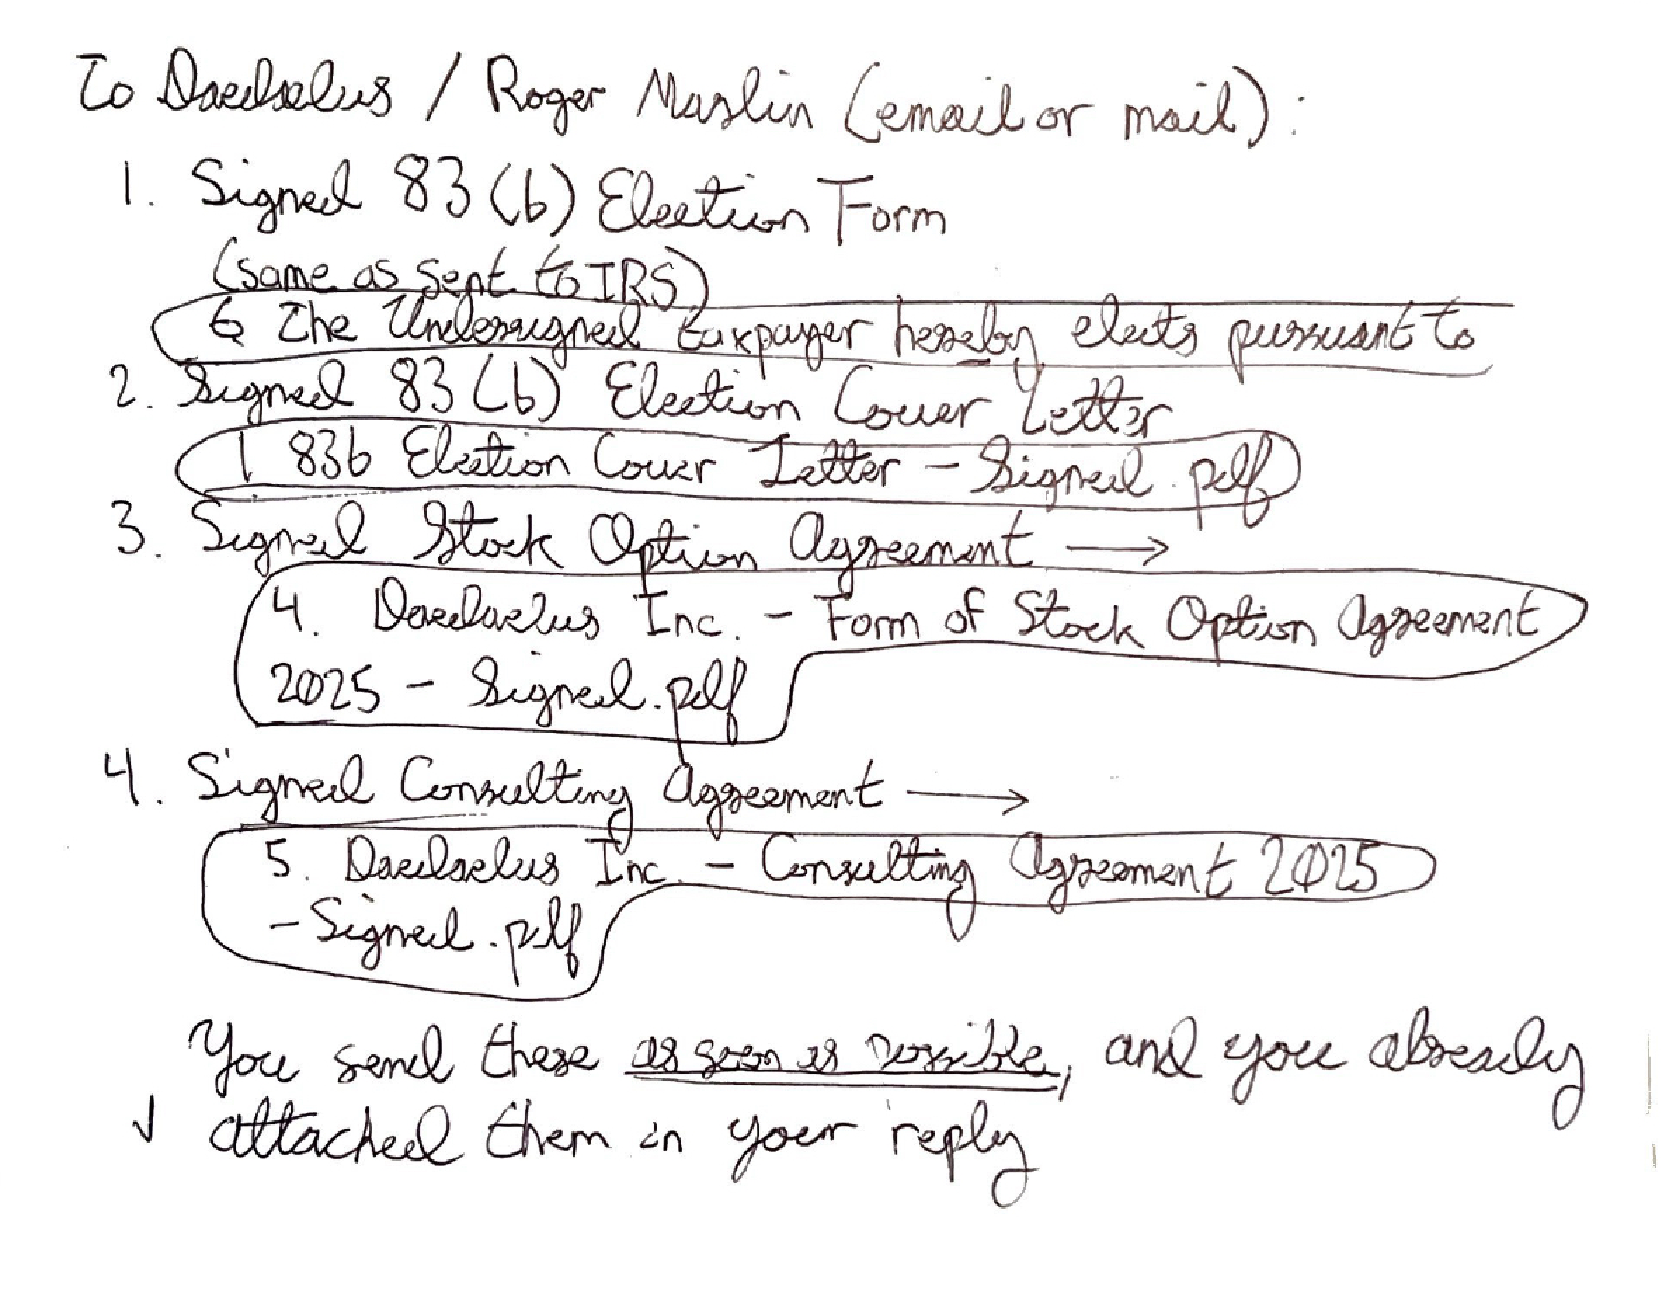
Internal State Synchronization: The Trusted Peer-to-Peer Transaction
Following the orchestration of the external transaction with the IRS, this note outlines the corresponding internal communication directed to a specific, named agent within the fabric: the CFO, Roger Marlin. This represents a different class of communication, analogous to the trusted, low-latency East-West interactions that occur between cells on our N2N Lattice.
Whereas the external filing required a high-overhead protocol to guarantee delivery to a remote, untrusted entity, this internal flow is an act of state synchronization between trusted peers. The same set of state-bearing tokens (the signed agreements) are transmitted, but the protocol is now email—a faster, more direct channel. This single originating event—the signing of the stock agreement—thus creates a multicast, triggering two distinct communication flows with different reliability and latency requirements. This highlights a core principle: the need for protocols that can differentiate between internal state alignment and external, irreversible transactions, applying the appropriate level of formal verification to each.
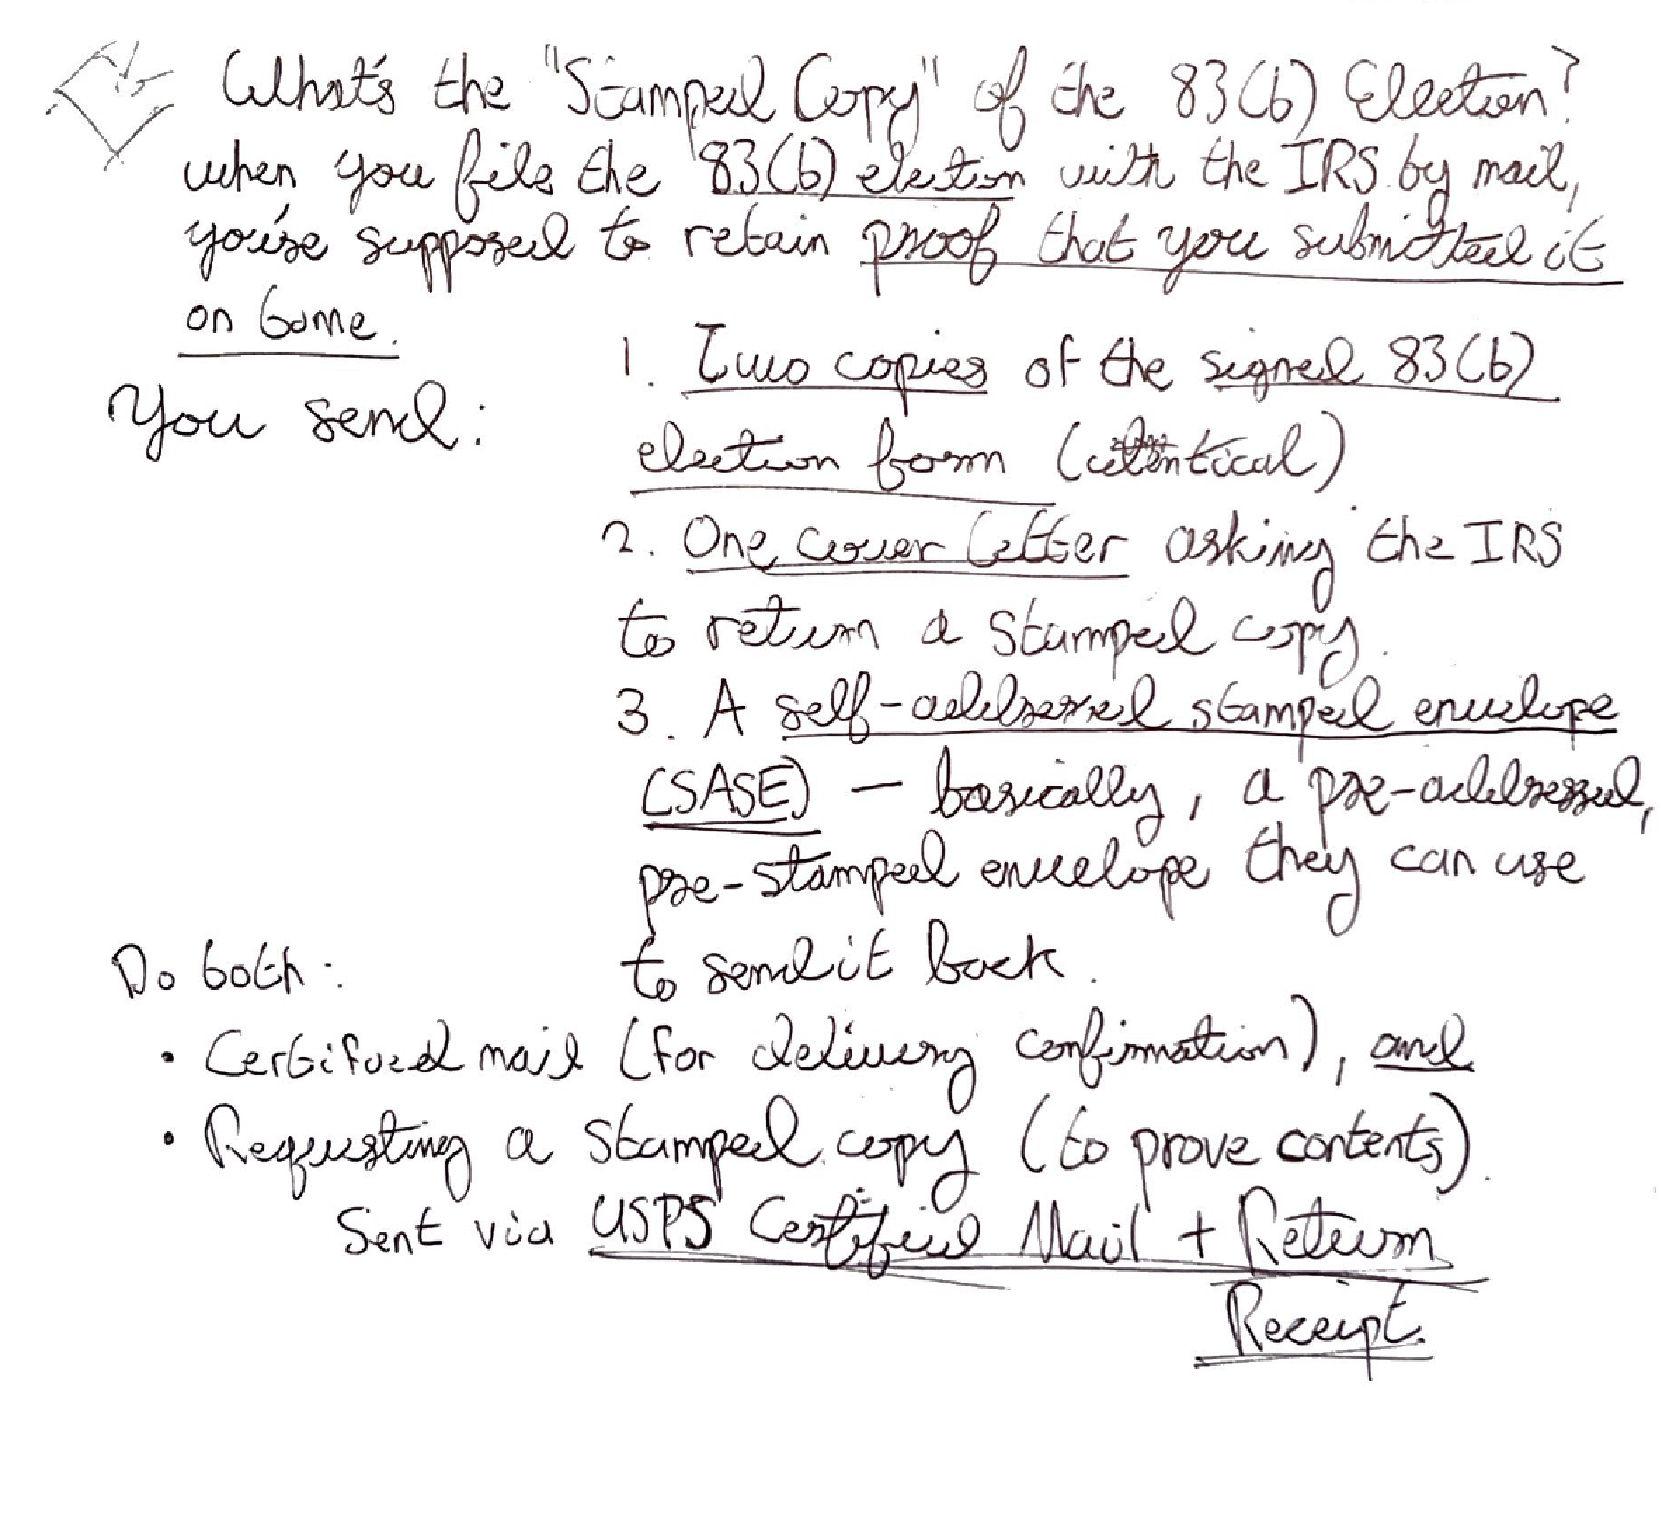
A Protocol for Verifiable Content Delivery
This note further dissects the protocol for achieving a verifiable transaction, distinguishing between simple “delivery confirmation” and the more robust “proof of contents.” This distinction is fundamental to our philosophy and highlights the shortcomings of conventional, lossy communication models.
The two proposed mechanisms represent different layers of reliability:
• Certified Mail provides confirmation of delivery, analogous to a low-level network acknowledgement. It confirms that a packet reached its destination but offers no insight into the integrity or processing of its contents. This leaves the sender in a state of uncertainty, mirroring how conventional systems can suffer silent failures where delivery is confirmed but the data is corrupted.
• Requesting a Stamped Copy elevates this to a true semantic handshake. By requiring the recipient (the IRS) to interact with and return a duplicate of the original message, the sender obtains incontrovertible proof that the content itself was received and acknowledged. This is the physical analog of a system that provides “systemic knowledge of an end-to-end handshake where both sender and receiver know the outcome of a transmission”.
This dual approach is a practical implementation of a reliable protocol built for an unreliable medium. It is designed to achieve what is impossible with simple timeouts and retries: a verifiable, exactly-once event where the sender knows the transaction has succeeded without ambiguity. It is a process designed to ensure the network—in this case, the U.S. Postal Service—is not allowed to “create a mess the application must discover and then clean up”.
Out[]=
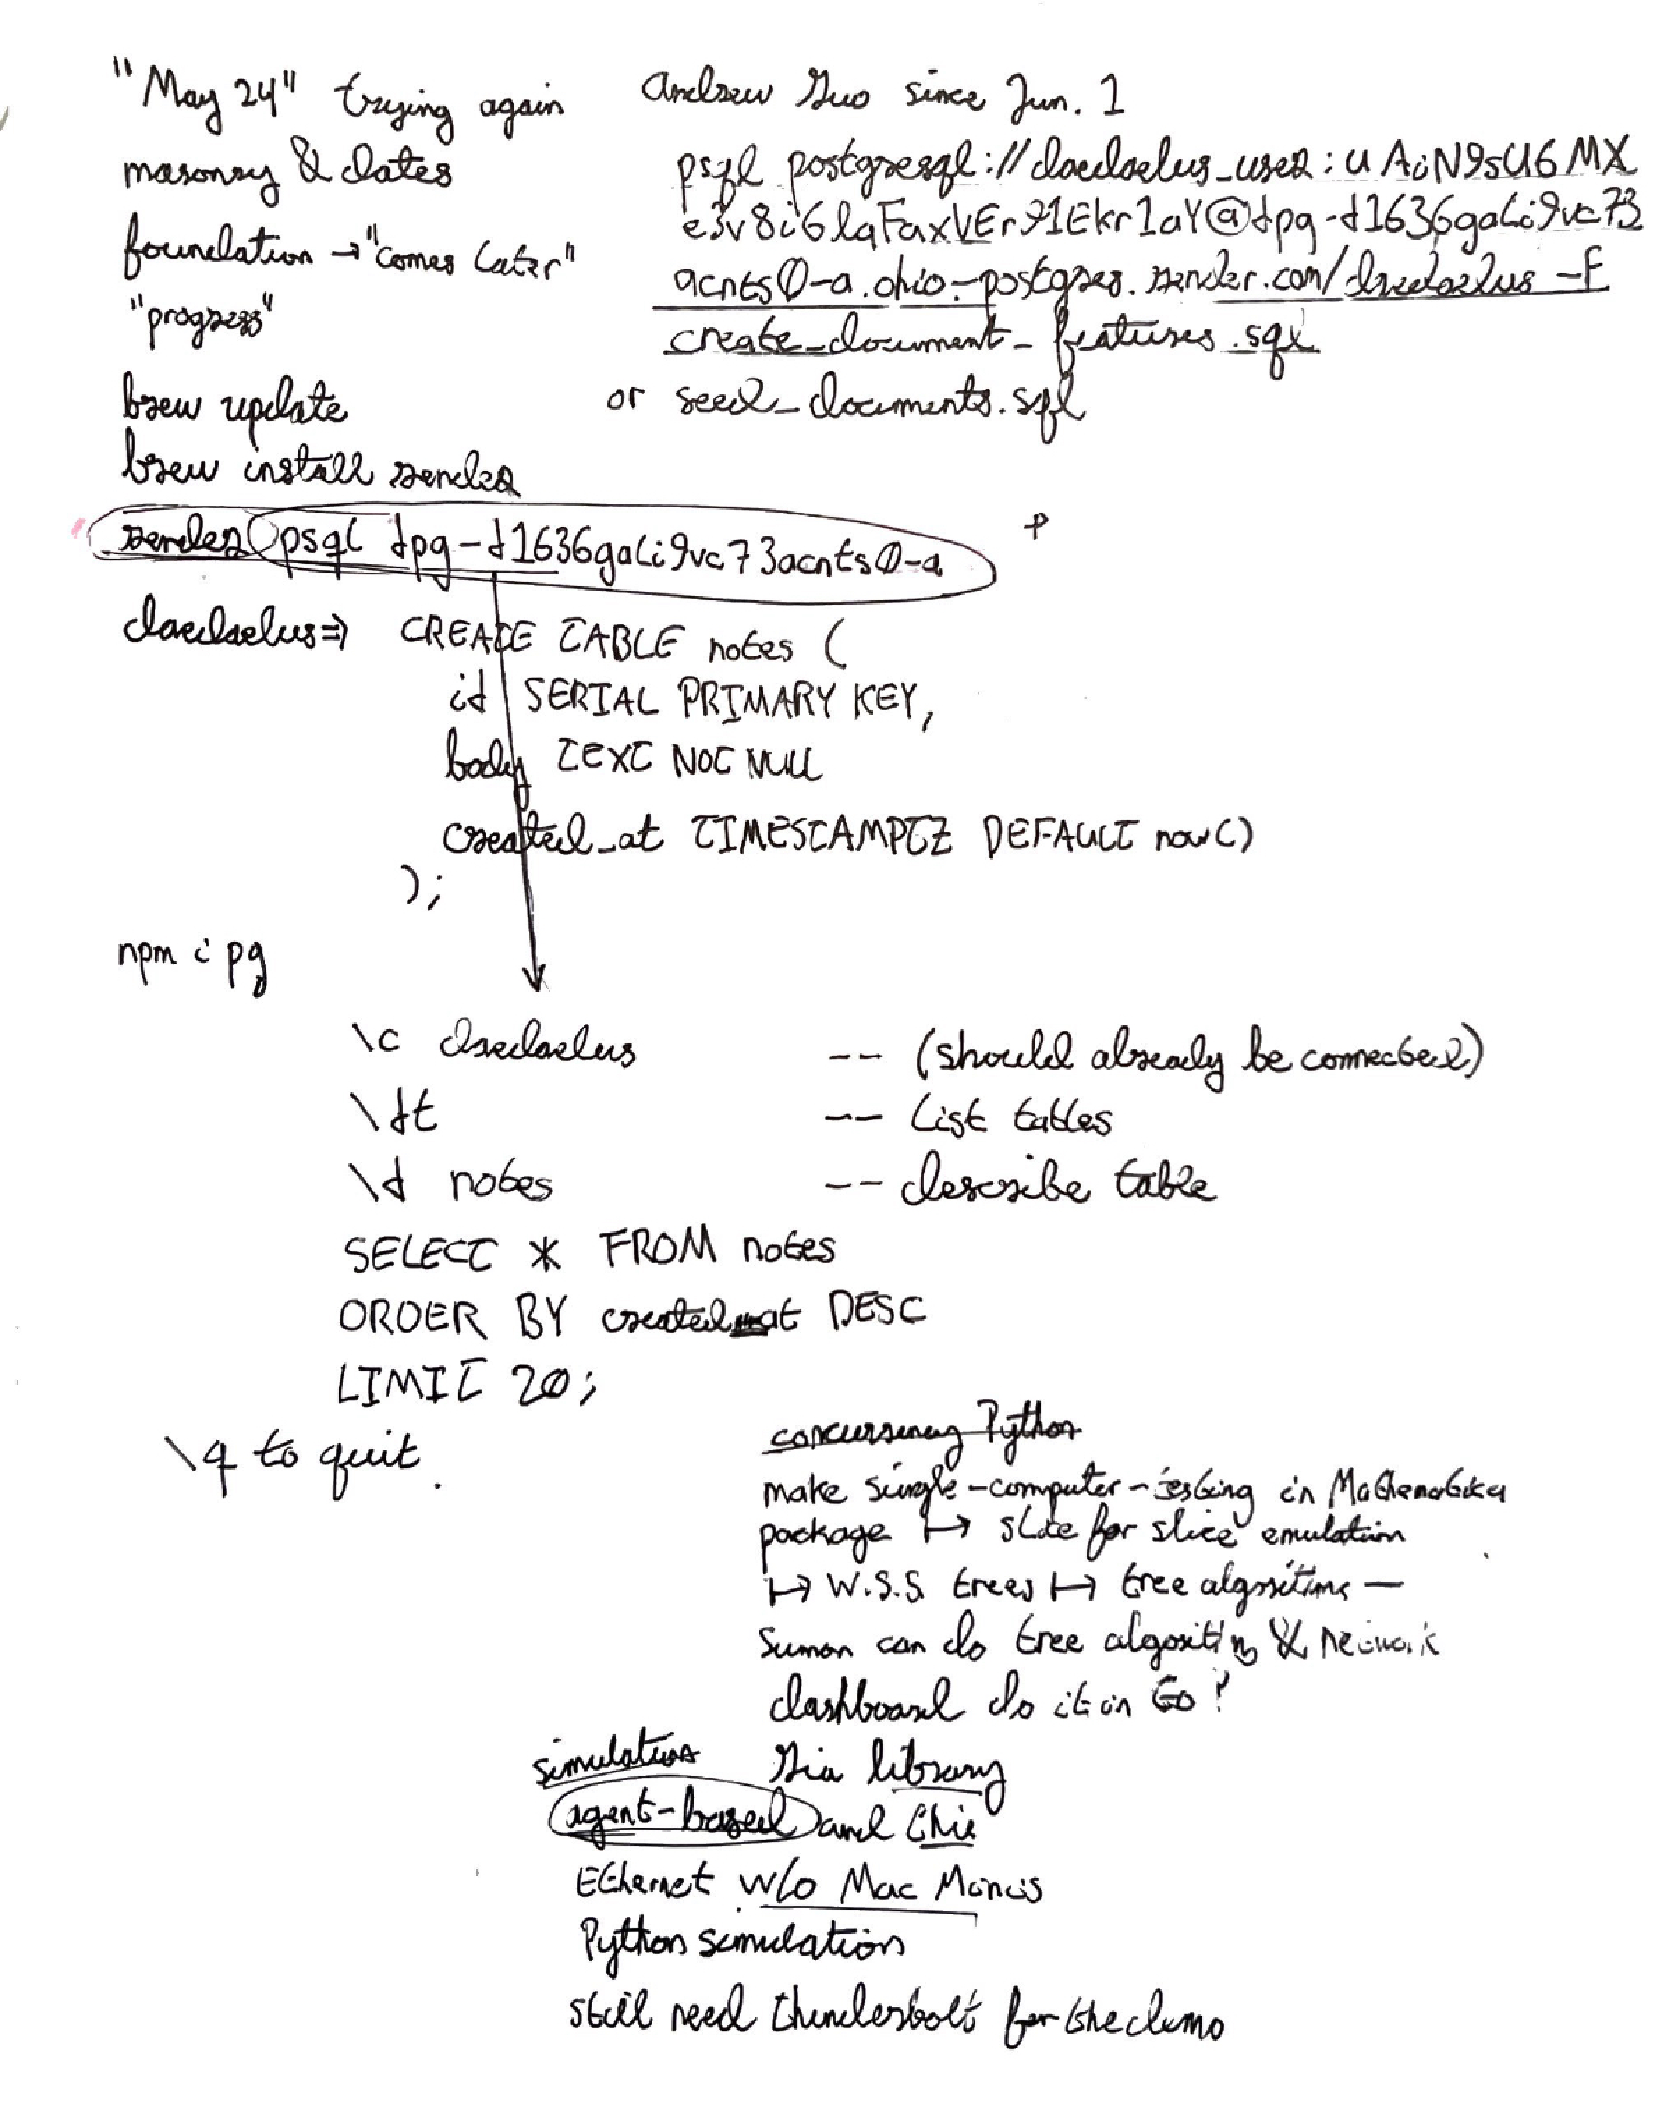
From Principle to Practice: Engineering the Transaction Fabric
This note captures the transition from high-level architectural principles to the concrete engineering tasks required to build the Daedaelus system. It outlines the multi-layered software stack and the specific tools chosen for each component, reflecting a deliberate approach to development, simulation, and visualization. The plan touches on every layer of the project, from the backend persistence to the physical hardware testbed.
The development plan detailed in the notes includes:
◼
Persistence Layer: A backend PostgreSQL database, hosted on Render, is used for storing project data, such as notes or simulation results. The commands detail the setup of a notes table, including a schema with a primary key, text body, and a timestamp for ordering events.
◼
Simulation and Emulation: The core logic is to be developed across multiple platforms.
• Mathematica is designated for initial “single-computer-testing” and modeling, serving as a platform for creating interactive proofs of concept.
• Python is specified for more complex simulations, particularly for handling concurrency. This includes building an “agent-based” model of Daedaelus and simulating Ethernet behavior without relying on the physical Mac Mini testbed. This work is targeted at the DDL_Emulator repository.
• Tree Algorithms, a foundational component for our GVM and routing protocols, are assigned to a new team member.
• Visualization and Control: A “dashboard” is planned, with Go being considered as the implementation language, likely to serve as a high-performance interface to the running emulator or physical network.
• Physical Testbed: The notes conclude with a crucial reminder that this software development is not purely academic; it must support a “physical demo” that “still need[s] thunderbolt”. This grounds the entire effort in the reality of our N2N hardware testbed, where the goal is to create a truly new communication fabric on physical links.
• Physical Testbed: The notes conclude with a crucial reminder that this software development is not purely academic; it must support a “physical demo” that “still need[s] thunderbolt”. This grounds the entire effort in the reality of our N2N hardware testbed, where the goal is to create a truly new communication fabric on physical links.
A Computational Model of the Classic Ethernet Contention Protocol
This notebook implements a detailed, agent-based simulation of the original Ethernet protocol as described in the seminal 1976 Metcalfe & Boggs paper. This is not a statistical approximation but a direct, computational model of the underlying mechanisms designed to serve as a form of “Code as Proof”. It provides an interactive environment to explore the dynamics of a shared, passive Ether and demonstrates how the coordination of access is distributed among contending stations through controlled statistical arbitration.
The simulation faithfully implements the core mechanisms of the protocol:
◼
Carrier Detection: Before transmitting, each station’s state machine checks if the channel is “IDLE”. A station will defer to any transmission already in progress.
◼
Interference Detection: The central updateChannel function monitors the number of active transmitters. If more than one station transmits in the same time slot, a “COLLISION” state is declared, which models the detection of interference.
◼
Collision Recovery: Upon collision, a station abandons its transmission and enters a “BKOFF” state. The backoff duration is determined by the Binary Exponential Backoff algorithm, where the retransmission interval is randomized based on the number of prior collisions for that packet.
◼
Collision Consensus Enforcement: When a collision is detected, the detectCollisions function forces all participating transmitters into a “JAM” state for a fixed duration. This ensures that all stations involved are aware of the collision and will proceed to the backoff phase, preventing a late transmitter from missing the event.
The Manipulate function provides an interactive dashboard to explore this complex system. By adjusting parameters such as the number of stations, packet size, and packet arrival rate (λ), one can directly observe the effects of contention on critical performance metrics. The output visualizations show the timeline of individual packet events, the average latency experienced by each station, and the overall utilization of the shared channel. This model serves as a foundational tool to demonstrate the inherent limitations of contention-based, bandwidth-multiplexing systems, highlighting how increased load inevitably leads to higher latency and degraded throughput.
An Event-Driven Model of a Contended Medium
An Event-Driven Model of a Contended Medium
This notebook presents a more sophisticated, event-driven simulation of the classic Ethernet protocol. Unlike a time-stepped approach, this model advances time based on a discrete queue of events, allowing for a more efficient and physically accurate representation of the network dynamics. This model explicitly incorporates the physical parameters of the communication channel, such as cableLength and signal propagation speed (c), to derive a realistic propagation delay (propDelay).
The simulation’s logic is built to demonstrate the core principles of controlled statistical arbitration for a shared, passive broadcast medium. A central event queue manages all network activity, scheduling events such as packet generation (“GEN”), transmission attempts (“TXSTART”), and the conclusion of backoff periods (“BOEND”).
A key refinement in this model is the explicit handling of the contention interval. When a station begins transmitting, a collision check event (“COLCHK”) is scheduled to occur after one propagation delay. This models the critical vulnerability window where a packet is on the Ether but has not yet been heard by all stations, making it possible for another station to begin transmitting and cause a collision. This precise modeling of the contention interval is crucial for accurately simulating the statistical nature of the access protocol.
The view function generates a comprehensive dashboard of the simulation results, providing quantitative evidence of the protocol’s performance under load. These visualizations include:
◼
Latency Distribution: A histogram showing the spread of packet delivery times.
◼
Throughput per Station: A bar chart illustrating how the channel’s capacity is shared among contending stations.
◼
Channel Utilization: A pie chart showing the percentage of time the Ether is busy transmitting successful packets versus remaining idle or in a collision state.
◼
Collisions per Station: A bar chart showing the distribution of detected collisions, a direct measure of the level of contention.
This event-driven simulation serves as a powerful “Code as Proof” tool. It moves beyond statistical formulas to provide a direct, computational demonstration of how a distributed system based on contention and statistical arbitration behaves under load, providing the foundational argument for why a shift from bandwidth multiplexing to transaction multiplexing is necessary.
Performance Analysis of a Physically-Aware Contention Model
Performance Analysis of a Physically-Aware Contention Model
This notebook represents our most advanced simulation of the classic Ethernet protocol, implementing a high-fidelity, event-driven model that explicitly accounts for the physical properties of the communication medium. Unlike previous models that treated the Ether as a purely logical entity, this simulation defines it as a physical cableLength upon which signals propagate at a finite propSpeed. Each station is assigned a specific physical position (pos), allowing the model to calculate the precise signal propagation delay between any two nodes.
This physical awareness enables a more realistic and nuanced implementation of the core CSMA/CD mechanisms:
• Location-Aware Carrier Sense: A station’s decision to transmit is based on whether a signal from any other active transmitter could have physically reached its position on the cable. This idleAtPos check is a direct simulation of “listening” to the local Ether.
• Pairwise Collision Detection: The collisionCheck function moves beyond a simple global “collision” state. It determines if a new transmission from one station will interfere with an existing transmission from another by calculating if their signals will overlap in time at any point on the Ether. This accurately models how interference is a function of the physical distance between contending stations.
• Distributed Statistical Arbitration: The simulation remains a model of fully distributed control. Access to the Ether is coordinated without a central authority through the emergent behavior of these physical checks combined with the established Binary Exponential Backoff algorithm for collision recovery.
The primary output of this simulation is the performance curve generated by perfPlot, which maps the relationship between offered load (λ), total system throughput, and the resulting collision rate. This graph is the critical piece of evidence produced by this “Code as Proof” exercise. It computationally demonstrates the fundamental trade-off inherent in any system based on statistical arbitration: as the offered load increases, the rate of collisions eventually overwhelms the channel, causing throughput to stagnate and collapse. This provides the definitive, quantitative argument for why a new architecture, one that escapes contention entirely, is necessary.
Performance Analysis: Achieved Throughput vs. Channel Capacity
Performance Analysis: Achieved Throughput vs. Channel Capacity
This notebook implements a final, rigorous, event-driven simulation of the classic Ethernet protocol, designed specifically to quantify the efficiency of a contended medium. Its purpose is to serve as “Code as Proof” for the core argument that raw channel capacity is a misleading metric for performance in a system governed by statistical arbitration. This simulation directly visualizes the gap between the theoretical bandwidth of the Ether and the actual throughput achieved by the stations contending for access.
The simulation refines previous models by using a priority queue for event management and meticulously tracking the state of the shared medium, including its cumulative busy time. This allows for a precise calculation of two key performance indicators:
• Achieved Throughput: The total number of useful data bits successfully delivered across the medium over the total simulation time.
• Channel Capacity Utilization: The theoretical maximum throughput, calculated from the raw dataRate of the channel multiplied by the fraction of time the channel was busy carrying successful transmissions.
The perfPlot function presents the central finding of this analysis: a direct bar chart comparison of the “Achieved” throughput against the theoretical “Channel Cap.” The difference between these two values represents the bandwidth that is irrecoverably lost to the arbitration protocol itself—time spent in collision, backoff, and inter-frame gaps. This provides a stark, quantitative visualization of the inherent inefficiency of any system based on distributed, statistical control.
By demonstrating that a significant fraction of the channel’s capacity is consumed by the contention protocol, this model provides the definitive evidence for our thesis. It shows that focusing on increasing raw bandwidth is futile when the access method itself is the bottleneck. True performance is not a function of raw capacity, but of the efficiency of the protocol used to access it. This simulation makes the case that to improve performance, one must escape the contention model entirely, which is the foundational goal of the Daedaelus architecture
Visualizing the Dynamics of a Contended Ether
Visualizing the Dynamics of a Contended Ether
This notebook provides the final analysis and visualization of our classic Ethernet simulation. It uses a discrete, time-stepped model to generate data that reveals the emergent, system-level consequences of distributed statistical arbitration. The purpose is to move beyond aggregate statistics and create a clear, visual narrative of how stations contend for and share a passive broadcast medium.
The output presents a comprehensive view of the system’s performance, centered on two key visualizations:
The output presents a comprehensive view of the system’s performance, centered on two key visualizations:
• Shared-Ether Activity Timeline: This plot provides a microscopic, time-series view of all activity on the shared channel. It clearly depicts the alternating transmission intervals, where a single station has successfully acquired the Ether, and the chaotic contention intervals, where multiple stations attempt to transmit simultaneously, resulting in a “COLLISION”. This visualization makes the abstract concept of statistical arbitration tangible, showing the moment-to-moment process of deference, collision, and backoff.
• End-to-End Packet Latency Distribution: This histogram is a crucial piece of evidence that highlights a fundamental flaw in contention-based systems. While the mean latency may appear acceptable, the histogram reveals a long tail of high-latency packets. This is the direct result of the probabilistic nature of the protocol, where some packets are unlucky and experience numerous collisions and long, random backoff delays. This visually confirms the problem of “unbounded tail latency” which our architecture is designed to eliminate through protocols that provide Truncated Tail Latency.
• End-to-End Packet Latency Distribution: This histogram is a crucial piece of evidence that highlights a fundamental flaw in contention-based systems. While the mean latency may appear acceptable, the histogram reveals a long tail of high-latency packets. This is the direct result of the probabilistic nature of the protocol, where some packets are unlucky and experience numerous collisions and long, random backoff delays. This visually confirms the problem of “unbounded tail latency” which our architecture is designed to eliminate through protocols that provide Truncated Tail Latency.
Together, these visualizations and the summary statistics provide the “Code as Proof” for our core argument. They demonstrate that while a contention-based protocol can function, it does so at the cost of significant inefficiency and unpredictable performance, reinforcing the need for a new architecture built on deterministic, reliable, and transaction-aware principles.
A Multi-faceted Analysis of Contention Dynamics
A Multi-faceted Analysis of Contention Dynamics
This notebook serves as the final, comprehensive analysis of our event-driven Ethernet simulation, presenting a rich, multi-panel dashboard designed to visualize the complex dynamics of a contended, shared medium. The simulation itself is a high-fidelity model of a network with fully distributed control , where independent cells vie for access to a passive broadcast medium using controlled statistical arbitration. The visualizations provide the definitive “Code as Proof” for the inherent limitations of this architecture.
The dashboard presents four distinct views of the system’s behavior:
• State of the Ether Timeline: This top-level view provides a macroscopic summary of the channel’s state over time. It visually separates the productive BUSY periods (transmission intervals) from the wasteful COLLISION periods (contention intervals), offering a clear, quantitative measure of the time lost to the arbitration protocol.
• Event Timeline: This microscopic view plots every significant event (generation, transmission start, collision, and successful delivery) for every cell. It reveals the chaotic, parallel interactions that are hidden by aggregate statistics.
• Throughput: This plot shows the instantaneous throughput of the system over time. Its volatile, bursty nature demonstrates the unpredictability of a system that relies on statistical access, where performance is not smooth or guaranteed.
• Latency PDF: This latency distribution histogram provides the most critical piece of evidence against conventional, contention-based protocols. It visually confirms the existence of a long tail of high-latency packets, a direct consequence of the random backoffs required to resolve collisions. This is the “unbounded tail latency” that our own architecture is explicitly designed to eliminate through protocols that guarantee Truncated Tail Latency.
Together, these plots demonstrate how a network based on contention fundamentally creates a “mess the application must discover and then clean up”. The dashboard makes the case that to achieve predictable, high-performance distributed systems, we must move beyond this model of statistical arbitration and adopt a new architecture where reliability and order are foundational properties, not afterthoughts.
Visualizing Congestion Collapse in a Contended System
Visualizing Congestion Collapse in a Contended System
This notebook provides a dynamic, time-series visualization of the state of a classic Ethernet system under load, using a physically-aware, event-driven simulation. By explicitly modeling the stationPositions along a physical cableLength, the simulation accurately calculates signal propagation delays, allowing for a realistic implementation of the distributed statistical arbitration protocol. The primary purpose of this model is to visually demonstrate the mechanisms that lead to congestion collapse in any system based on contention.
The multi-panel dashboard provides a holistic view of the system’s state as it evolves over time:
• Ethernet Station Positions: This plot grounds the simulation in a physical topology, where the distances between stations directly impact the collision dynamics.
• Channel Utilization: This time-series plot shows the number of active stations contending for the channel. Its erratic, spiky nature is a clear indicator of the chaotic arbitration process.
• Queue Length: This plot is the most critical piece of evidence. It shows the total number of packets waiting in all station queues. A steadily increasing queue length, as seen in the example, is the definitive signature of congestion collapse—a state where packets are arriving faster than the contended medium can service them, leading to unbounded latency and system failure.
• Packet Transmission Latency: This histogram complements the queue length data, showing the resulting distribution of latencies. The wide spread and long tail are direct consequences of the contention and growing queues.
This notebook serves as a powerful “Code as Proof” instrument. It moves beyond static metrics to show the process of system degradation in real time. The runaway queue length provides incontrovertible visual evidence that a system based on statistical contention is fundamentally unstable under heavy load, leading to the “unbounded tail latency and transaction failure” that our architecture is designed to prevent.
Quantitative Analysis of a Half-Duplex Contention System
This notebook provides a final, quantitative analysis of the classic half-duplex Ethernet protocol, using a refined event-driven simulation to measure its emergent performance characteristics. As the capstone of our “Code as Proof” investigation into foundational networking principles, this model computes and displays the key metrics that define the efficiency and predictability of a system based on controlled statistical arbitration.
The simulation meticulously models a set of distributed computing stations contending for a shared medium. The core logic implements the well-understood mechanisms of carrier sense, collision detection, and binary exponential backoff. After running the simulation, a comprehensive set of statistics is calculated, including:
• Throughput: The rate of useful data delivered, representing the system’s goodput.
• Efficiency: The achieved throughput as a percentage of the theoretical channel bit rate. This metric directly computes the efficiency (E) analyzed in the original Metcalfe paper, quantifying the bandwidth lost to the arbitration protocol.
• Average Latency: The mean end-to-end delivery time for all successful packets.
• Delivery Ratio: The fraction of generated packets that are successfully delivered, indicating the rate of packet loss due to excessive collisions.
The primary visual output, the Packet Latency Distribution histogram, serves as the definitive evidence of the protocol’s fundamental limitation. It provides a clear visualization of the long tail due to Network sharing and (unbounded) retries. While the average latency may be low, the significant spread and long tail demonstrate the unpredictability inherent in a system where packet delivery time is subject to a random number of collisions and retransmission delays. It is this tail latency that our architecture is designed to eliminate through an atomic protocol that provides Truncated Tail Latency. This final analysis makes the quantitative case for a new architecture, one that replaces probabilistic contention with deterministic, reliable transactions.
◼
Modeling an Acknowledged Protocol on a Half-Duplex Contended Medium
This notebook simulates a reliable, acknowledged data transfer protocol operating over a classic, half-duplex Ethernet medium. The purpose is to demonstrate the profound inefficiency that arises when the round-trip interactions required for reliable communication must themselves compete for a single, statistically arbitrated channel. This model serves as a direct, computational proof of the arguments made against simple bandwidth-multiplexing.
In this simulation, a transaction is only successful when a station transmits a data packet and subsequently receives an acknowledgment (ACK) from the recipient. This introduces a critical challenge: both the initial data packet and the returning ACK packet must independently contend for and acquire the shared Ether. This model is a computational realization of a “Bandwidth-Multiplexed Channel”, where multiple, independent, two-way conversations are forced to interfere with each other.
The simulation results provide a stark illustration of the consequences:
◼
Extreme Inefficiency: The statistics show a high number of collisions relative to successful transmissions, leading to extremely low overall channel efficiency. Because every successful data delivery requires a second, separate, and equally contended ACK transmission, the probability of completing a full transaction is dramatically reduced.
◼
Transaction Failure: The most telling result is the “No RTT measurements recorded.” This is not a bug; it is the core finding. It demonstrates that the contention is so severe and the medium so inefficient that, within the simulation’s runtime, not a single station was able to complete a full round-trip transaction.
◼
This model provides definitive “Code as Proof” that layering reliable, two-way protocols on top of a half-duplex, contended medium leads to a catastrophic degradation of performance. It shows how multiplexing bandwidth decimates the transactional capacity of the link. This result makes the unequivocal case for an architecture that moves beyond this model, using full-duplex links and a protocol that understands and optimizes for the entire round-trip interaction.
Analysis of the Full Round-Trip Interaction
This final notebook culminates our analysis by simulating the entire lifecycle of a reliable, round-trip interaction—the fundamental unit of computation in any distributed system that requires certainty. This event-driven model moves beyond one-way packet delivery to include the generation, transmission, and successful return of acknowledgements (ACKs) over a classic, contended Ether. By doing so, it allows for the direct measurement of end-to-end Round-Trip Time (RTT) and exposes the profound performance costs of layering reliable protocols on top of a statistically arbitrated medium.
The simulation models the complete two-way exchange:
1. A station sends a DATA packet, contending for the channel.
2. Upon successful receipt, the destination generates and queues an ACK packet.
3. The destination station must then contend for the very same channel to send the ACK back.
4. Only upon receipt of the ACK is the transaction considered complete and the RTT measured.
The results provide the definitive “Code as Proof” of the inherent flaws in this architecture:
◼
RTT Instability and Tail Latency: The “Per-packet RTT” plot shows wild fluctuations in latency, while the “RTT Distribution” histogram reveals a significant tail. This demonstrates how the tandem processes of data and ACK contention create unpredictable, unbounded tail latency, a core problem that makes it impossible to provide reliable, low-latency transaction processing. This is the direct result of a system requiring “timeouts and retries to maintain liveness”.
◼
Arbitration Fairness: The “Collision probability per station” plot reveals another critical issue. Statistical arbitration is not inherently fair; subtle timing and positional advantages can lead to certain stations experiencing disproportionately high collision rates. This introduces an “insidious non-determinism” into the system’s performance.
This simulation proves that forcing independent, two-way transactions to compete for a single contended resource results in chaotic, unfair, and unpredictable performance. It makes the ultimate case for the Daedaelus architecture, which is designed to provide deterministic, low-latency, and fair transactional capacity by building reliability and order into the fabric itself.
Analysis of the Full Round-Trip Interaction
This final notebook culminates our analysis by simulating the entire lifecycle of a reliable, round-trip interaction—the fundamental unit of computation in any distributed system that requires certainty. This event-driven model moves beyond one-way packet delivery to include the generation, transmission, and successful return of acknowledgements (ACKs) over a classic, contended Ether. By doing so, it allows for the direct measurement of end-to-end Round-Trip Time (RTT) and exposes the profound performance costs of layering reliable protocols on top of a statistically arbitrated medium.
The simulation models the complete two-way exchange:
1. A station sends a DATA packet, contending for the channel.
2. Upon successful receipt, the destination generates and queues an ACK packet.
3. The destination station must then contend for the very same channel to send the ACK back.
4. Only upon receipt of the ACK is the transaction considered complete and the RTT measured.
The results provide the definitive “Code as Proof” of the inherent flaws in this architecture:
This final notebook culminates our analysis by simulating the entire lifecycle of a reliable, round-trip interaction—the fundamental unit of computation in any distributed system that requires certainty. This event-driven model moves beyond one-way packet delivery to include the generation, transmission, and successful return of acknowledgements (ACKs) over a classic, contended Ether. By doing so, it allows for the direct measurement of end-to-end Round-Trip Time (RTT) and exposes the profound performance costs of layering reliable protocols on top of a statistically arbitrated medium.
The simulation models the complete two-way exchange:
1. A station sends a DATA packet, contending for the channel.
2. Upon successful receipt, the destination generates and queues an ACK packet.
3. The destination station must then contend for the very same channel to send the ACK back.
4. Only upon receipt of the ACK is the transaction considered complete and the RTT measured.
The results provide the definitive “Code as Proof” of the inherent flaws in this architecture:
◼
RTT Instability and Tail Latency: The “Per-packet RTT” plot shows wild fluctuations in latency, while the “RTT Distribution” histogram reveals a significant tail. This demonstrates how the tandem processes of data and ACK contention create unpredictable, unbounded tail latency , a core problem that makes it impossible to provide reliable, low-latency transaction processing. This is the direct result of a system requiring “timeouts and retries to maintain liveness”.
◼
Arbitration Fairness: The “Per-station Collision Probability” plot reveals another critical issue. Statistical arbitration is not inherently fair; subtle timing and positional advantages can lead to certain stations experiencing disproportionately high collision rates. This introduces an “insidious non-determinism” into the system’s performance.
This simulation proves that forcing independent, two-way transactions to compete for a single contended resource results in chaotic, unfair, and unpredictable performance. It makes the ultimate case for the Daedaelus architecture, which is designed to provide deterministic, low-latency, and fair transactional capacity by building reliability and order into the fabric itself.
This simulation proves that forcing independent, two-way transactions to compete for a single contended resource results in chaotic, unfair, and unpredictable performance. It makes the ultimate case for the Daedaelus architecture, which is designed to provide deterministic, low-latency, and fair transactional capacity by building reliability and order into the fabric itself.
Unveiling the Unfairness and Unpredictability of Statistical Arbitration
This final simulation notebook serves as a detailed investigation into the fairness and latency fine-structure of the classic Ethernet protocol. Using a high-fidelity, event-driven model, this analysis moves beyond aggregate metrics to expose the subtle but critical flaws that emerge from a system based on controlled statistical arbitration. The visualizations generated here provide the definitive “Code as Proof” that such a system is not only inefficient but also fundamentally unpredictable and potentially unfair.
The dashboard presents two critical diagnostic plots:
◼
Collision Rate by Station: This plot directly measures the probability of collision for each individual station. In a truly fair system, these probabilities would be roughly equal. The visualization, however, often reveals significant disparities, demonstrating that the random backoff protocol does not guarantee fairness. Some stations can be systematically starved or suffer a disproportionate share of collisions, a perfect example of the “insidious non-determinism” that plagues contention-based systems.
◼
Packet-Latency Distribution: This plot uses a Kernel Density Estimate (KDE) to reveal the underlying probability distribution of packet latencies. A healthy, predictable system would exhibit a single, tight peak. Instead, the simulation reveals a multimodal distribution with a significant tail, indicating that packets fall into multiple, distinct latency classes based on the number of collisions they experience. This is the visual signature of unbounded tail latency—a direct consequence of a protocol that relies on unbounded retries to function.
This analysis concludes our critique of the classic Ethernet model. It demonstrates that a system with fully distributed control based on statistical contention is incapable of providing the predictable, fair, and low-latency performance required by modern distributed applications. It makes the ultimate case for the Daedaelus architecture, which replaces probabilistic arbitration with deterministic, transaction-aware protocols designed to deliver Truncated Tail Latency.
The Ethernet Activity Score: A Visual Timeline of Contention
The Ethernet Activity Score: A Visual Timeline of Contention
This notebook implements a time-stepped simulation designed to produce an “Ethernet Activity Score”—a detailed, visual timeline that captures the state of each station as it contends for a shared, passive broadcast medium. Fulfilling a key project goal to create a “timeline of the medium”, this simulation moves beyond aggregate statistics to provide a microscopic, moment-to-moment view of how the channel is arbitrated over time.
The core of this notebook is the activityLog, which records the start and end time of every state for each station. This log is then used to generate the activity score plot, which visualizes:
◼
Successful Transmissions: Periods where a single station has acquired the Ether and is sending data.
◼
Collisions: The precise moments when a station’s transmission is corrupted by an overlapping transmission from another station.
◼
Jamming: The brief period following a collision where a station jams the Ether to ensure collision consensus enforcement.
This visualization serves as the most direct “Code as Proof” of the dynamics of controlled statistical arbitration. It makes the abstract concepts of the protocol tangible. One can clearly see a successful transmission from one station (a dark block) being interrupted by a “collision” (a red marker) when another station attempts to transmit within the propagation delay window. This is followed by both stations entering a “jamming” state (an orange block) before they begin their random backoff periods.
The resulting score is a clear illustration of the “mess the application must discover and then clean up” in a conventional network. The timeline, with its patchwork of productive transmissions and wasteful contention events, demonstrates the fundamental inefficiency of a system that relies on statistical chance to function. It provides the definitive visual argument for an architecture that replaces probabilistic contention with deterministic, reliable transactions.
The resulting score is a clear illustration of the “mess the application must discover and then clean up” in a conventional network. The timeline, with its patchwork of productive transmissions and wasteful contention events, demonstrates the fundamental inefficiency of a system that relies on statistical chance to function. It provides the definitive visual argument for an architecture that replaces probabilistic contention with deterministic, reliable transactions.
Visualizing the Local Observer View of a Contended Medium
Visualizing the Local Observer View of a Contended Medium
This notebook uses a time-stepped simulation of a classic contended Ether to generate and compare two distinct visualizations of the same underlying event data. The goal is to demonstrate how the choice of visualization can shift our understanding from a global view of channel chaos to a more insightful, agent-centric perspective. This aligns with our core principle that robust distributed systems must be designed to function using only a Local Observer View (LOV).
The simulation generates a log of all key events (transmission starts, successes, and collisions) and uses it to render two plots:
• Classic Timeline: This presents a traditional, global view of all events on a single time axis. While it shows the density and timing of events, it can obscure the experience of any single participant in the network.
• Score View: This custom visualization provides a far more intuitive representation of the Local Observer View. Each station is given its own horizontal staff, and its specific events are plotted along it as distinct symbols. This allows one to follow the narrative of a single station’s attempts to communicate: a successful transmission is a start event followed by a success marker, while a failed attempt is a start event followed by a collision marker.
The “Score View” is a powerful piece of “Code as Proof” because it visually decomposes the global “mess” of a contended medium into the individual experiences of the stations. It is this local, partial information that any real-world distributed agent must use to make decisions. Our own architecture is designed to function and heal dynamically using this Local Observer View (LOV) information only. By visualizing the problem from this perspective, we make the case for a system that is not built on global statistical chance, but on the foundation of reliable, deterministic, peer-to-peer interactions.
This final notebook presents a dynamic dashboard for analyzing the real-time performance of a reliable, acknowledged protocol operating over a classic contended medium. Moving beyond static, end-of-run statistics, this simulation uses time-series analysis—specifically, moving averages—to visualize the evolving relationship between throughput and collisions, offering a powerful, dynamic view of the system’s instability.
The simulation models the full round-trip handshake required for reliable data transfer and presents the results in a comprehensive dashboard:
• Event Timeline: A microscopic view of every key event—Data OK, ACK OK, and Collision—providing a granular record of the channel’s activity.
• RTT Distribution: A smoothed histogram of the round-trip times, which clearly shows the wide variance and significant tail latency that results from the contention protocol. This is a direct consequence of the “unbounded retries” required for error recovery in such systems.
• Throughput and Collision Plots: These two plots, displayed side-by-side, form the core of the argument. They show the smoothed, time-averaged throughput and collision rates. Their stark inverse relationship provides the definitive “Code as Proof”: as the rate of collisions spikes, throughput plummets. This visually demonstrates that the statistical arbitration protocol itself is the primary impediment to performance.
This dashboard makes the “mess the application must discover and then clean up” undeniable. The chaotic fluctuations in performance reveal a system that is fundamentally unpredictable and incapable of providing the stable, low-latency guarantees required for modern distributed applications. It serves as the final, compelling argument that to achieve robust performance, we must abandon the model of contention entirely and adopt an architecture that provides Truncated Tail Latency by design.
The End-to-End Consequences of Contention: A TCP RTT Analysis
The End-to-End Consequences of Contention: A TCP RTT Analysis
This final notebook presents our culminating analysis: a simulation of a TCP-like acknowledged protocol operating over a classic, shared Ethernet. By modeling the full round-trip transaction—from the initial transmission attempt of a DATA packet to the successful receipt of its corresponding ACK—this simulation provides the definitive “Code as Proof” of the catastrophic end-to-end performance consequences of statistical contention.
The simulation meticulously tracks the lifecycle of each transaction to measure the true Round-Trip Time (RTT), which includes not only transmission and propagation delays but also the highly variable delays introduced by collisions and random backoffs. The primary result is the “TCP RTT Distribution” histogram.
This visualization is the ultimate indictment of the contention-based model. A predictable, reliable network would produce a tight, unimodal distribution of RTTs. Instead, we see a wide, sparse, and multimodal distribution. This is the unmistakable signature of a chaotic system, providing clear, quantitative evidence of the “unbounded tail latency and transaction failure” that plagues conventional networks. It shows how layering a reliable protocol on an unreliable medium forces the use of “timeouts and retries to maintain liveness”, a mechanism that makes “exactly-once semantics impossible”.
This simulation proves that the problems of a contended Ether are not merely an issue of L2 efficiency; they create a fundamental “mess the application must discover and then clean up” at the transport layer. It provides the final, compelling argument for the Daedaelus architecture, which provides guaranteed service and lower latency by eliminating contention at the foundational level, thereby enabling truly reliable distributed systems.
Performance and Utilization Analysis of a Saturated, Contended System
Performance and Utilization Analysis of a Saturated, Contended System
This notebook presents a final, holistic performance dashboard generated by a time-stepped simulation of a classic Ethernet under heavy, continuous load. The simulation employs a closed-loop model where each station immediately attempts to send a new packet upon the successful acknowledgment of the previous one. This approach is designed to saturate the channel, allowing for a clear analysis of the system’s behavior at its performance limits and providing the definitive “Code as Proof” of the inherent costs of controlled statistical arbitration.
The multi-panel dashboard provides a comprehensive view of the system’s performance trade-offs:
• Channel Utilization: This pie chart offers the most direct and damning evidence of the inefficiency of a contended medium. It provides a clear, quantitative breakdown of how the channel’s time is spent: a fraction on productive work (transmitting DATA and ACK packets), a fraction idle, and a significant fraction irrecoverably wasted on collisions. This “Collisions” slice is the measurable cost of the arbitration protocol.
• Per-Station Throughput: This plot shows the highly variable and chaotic throughput achieved by each station over time. It demonstrates that no station can maintain a stable data rate; instead, they are locked in a constant battle for the medium, leading to the “unbounded tail latency and transaction failure” that plagues such systems.
• RTT Distribution and RTT vs. Station Load: These plots provide a deep dive into the latency characteristics. The RTT distribution again reveals the long tail of unpredictable delays, while the RTT vs. Load plot allows for an analysis of fairness, showing how increased station activity impacts its own end-to-end latency.
This dashboard makes the “mess the application must discover and then clean up” quantifiable. It proves that even when fully utilized, a significant portion of a contended channel’s capacity is consumed by the very protocol designed to manage it. This makes the final case for the Daedaelus architecture, which is designed to eliminate this waste and provide deterministic, high-efficiency, and reliable transactions with Truncated Tail Latency.
This final notebook concludes our analysis of classic Ethernet by presenting a clean, narrative visualization of the event-level dynamics on a contended channel. The simulation models the full, acknowledged round-trip lifecycle of multiple competing stations and plots every critical event on a master timeline. This provides an intuitive and undeniable visual record of the successes and, more importantly, the failures inherent in a system based on controlled statistical arbitration.
The primary output is the Event timeline. This plot displays the history of the shared medium as a sequence of discrete, color-coded events for each station:
The primary output is the Event timeline. This plot displays the history of the shared medium as a sequence of discrete, color-coded events for each station:
◼
Packet Generation: The moment a station has new data to send.
◼
Transmission Start: The moment a station, after finding the channel idle, begins to transmit.
◼
Successful Transmission: The moment a data packet is successfully delivered.
◼
Collision: The moment a transmission attempt fails due to interference from another station.
This timeline serves as our final piece of “Code as Proof”. One can easily trace the journey of a single transmission attempt and see it fail: a transmission start event is immediately followed by a collision event, forcing the station into a random backoff and retry cycle. This is a direct, visual representation of the “mess the application must discover and then clean up”. It shows, unequivocally, how the contention protocol itself is the source of the delays and unpredictability that lead to unbounded tail latency.
Having demonstrated the fundamental, chaotic nature of statistical arbitration, we make the case for a new architecture. The following sections will introduce the Daedaelus protocol, a system designed from first principles to eliminate collisions, guarantee delivery, and provide the deterministic, low-latency performance required for reliable distributed computing.
Having demonstrated the fundamental, chaotic nature of statistical arbitration, we make the case for a new architecture. The following sections will introduce the Daedaelus protocol, a system designed from first principles to eliminate collisions, guarantee delivery, and provide the deterministic, low-latency performance required for reliable distributed computing.
The Relationship Between Utilization and Transaction Latency
The Relationship Between Utilization and Transaction Latency
This event-driven simulation is designed to explore one of the most fundamental trade-offs in a contention-based system: the relationship between channel utilization and the end-to-end latency of a reliable, acknowledged transaction. The model simulates a closed loop of communication, where stations attempt to maintain a continuous flow of data, allowing us to observe the system’s performance under sustained load.
The simulation’s primary outputs are the Network Utilization and Collision Rate metrics, juxtaposed with the RTT Distribution histogram. This comparison serves as a powerful piece of “Code as Proof” for a core Daedaelus thesis: in a system based on statistical arbitration, high channel utilization is achieved at the direct cost of transaction reliability and predictability. The simulation demonstrates that as stations attempt to keep the channel busy, the rate of collisions inevitably rises.
Each of these collisions, along with the explicit TIMEOUT mechanism modeled for recovering lost ACKs, contributes to a highly variable and unpredictable Round-Trip Time. The resulting RTT distribution shows a significant spread, a clear visualization of the “long tail due to Network sharing and (unbounded) retries”. This is the practical consequence of a system that relies on “timeouts and retries to maintain liveness”.
This notebook demonstrates that optimizing for high channel utilization is a flawed objective, as it necessarily leads to a chaotic and high-latency environment for the round-trip interactions that applications actually depend on. It makes the case that true network performance must be measured not by how busy the medium is, but by the efficiency and predictability with which it can complete transactions—the central design goal of the Daedaelus architecture.
Final Analysis: Confronting Simulation with Foundational Theory
Final Analysis: Confronting Simulation with Foundational Theory
This notebook provides the culminating analysis of the classic Ethernet protocol, directly confronting the emergent results of a high-fidelity, slot-based simulation with the foundational theoretical limits described by Metcalfe. This final piece of “Code as Proof” serves to both validate our computational model and to provide a definitive, quantitative demonstration of the inherent performance ceiling imposed by any system based on controlled statistical arbitration.
The simulation meticulously models the behavior of distributed stations contending for a shared medium. From its output, we derive and visualize two critical perspectives on the system’s performance:
• The Microscopic View: The Ethernet Activity Timeline provides a granular, event-level view of the channel, plotting every transmission start, collision, and completion. It is a visual record of the chaotic, local interactions from which the system’s global performance emerges.
• The Macroscopic View: The Efficiency Comparison plot provides a high-level, quantitative summary. It directly compares the Simulated Utilization achieved in our model against the Theoretical Maximum efficiency and Acquisition Probability calculated from the formulas in the original Ethernet paper.
The close agreement between our simulated results and the theoretical maximum validates the accuracy of our model. More importantly, it provides the final, undeniable evidence that the efficiency of a contended network is fundamentally capped. The gap between the theoretical maximum and 100% utilization represents the unavoidable cost of the arbitration protocol itself—a price paid in wasted time due to the very physics of signal propagation and collision detection.
This concludes our analysis of the classic model. Having proven the existence of this hard performance ceiling, we have established the necessity for a new architecture that is not bound by the mathematics of contention.
This final simulation provides the most comprehensive analysis in our series, modeling not only the Layer 2 contention of classic Ethernet but also a simplified version of TCP' s Layer 4 adaptive timeout mechanism . By simulating the Jacobson/Karels algorithm for calculating the retransmission timeout (RTO) based on smoothed RTT and variance, this notebook demonstrates how the entire conventional protocol stack conspires to produce unpredictable performance . It serves as our conclusive "Code as Proof" that reliability cannot be effectively patched onto an inherently chaotic foundation .
This simulation provides a multi-faceted view of the system’s performance under load:
This simulation provides a multi-faceted view of the system’s performance under load:
◼
Ethernet Medium State Timeline: This plot provides a macroscopic view of the channel, showing its state (IDLE, BUSY, or COLLISION) at every time slot. The rapid, erratic state changes are the visual signature of a system governed by the unpredictable outcomes of statistical arbitration.
◼
TCP RTT Distribution: The resulting distribution of round-trip times is a direct consequence of the underlying chaos. Its wide variance and long tail are the result of the “unbounded retries” forced by the contended medium, a problem that TCP’s timeout logic can only react to, not prevent.
◼
Collisions per Station: This plot provides a clear measure of fairness, often revealing that the burden of collisions is not shared equally. This illustrates the “insidious non-determinism” that makes it impossible to provide any quality of service guarantees.
By modeling the full stack, this simulation demonstrates that the problem is foundational . TCP' s reliance on "timeouts and retries to maintain liveness" is a reaction to a medium that is fundamentally unreliable . The result is a system that creates a "mess the application must discover and then clean up" . This provides the definitive motivation for the Daedaelus architecture, which achieves Truncated Tail Latency and guaranteed service by building determinism and reliability into the fabric itself, rather than leaving it as an exercise for higher - level protocols .
A Full-Stack Analysis: TCP’s Adaptive Timeouts on a Contended Medium
A Full-Stack Analysis: TCP’s Adaptive Timeouts on a Contended Medium
This final simulation provides the most comprehensive analysis in our series, modeling not only the Layer 2 contention of classic Ethernet but also a simplified version of TCP’s Layer 4 adaptive timeout mechanism. By simulating the Jacobson/Karels algorithm for calculating the retransmission timeout (RTO) based on smoothed RTT and variance, this notebook demonstrates how the entire conventional protocol stack conspires to produce unpredictable performance. It serves as our conclusive “Code as Proof” that reliability cannot be effectively patched onto an inherently chaotic foundation.
This simulation provides a multi-faceted view of the system’s performance under load:
• Ethernet Medium State Timeline: This plot provides a macroscopic view of the channel, showing its state (IDLE, BUSY, or COLLISION) at every time slot. The rapid, erratic state changes are the visual signature of a system governed by the unpredictable outcomes of statistical arbitration.
• TCP RTT Distribution: The resulting distribution of round-trip times is a direct consequence of the underlying chaos. Its wide variance and long tail are the result of the “unbounded retries” forced by the contended medium, a problem that TCP’s timeout logic can only react to, not prevent.
• Collisions per Station: This plot provides a clear measure of fairness, often revealing that the burden of collisions is not shared equally. This illustrates the “insidious non-determinism” that makes it impossible to provide any quality of service guarantees.
By modeling the full stack, this simulation demonstrates that the problem is foundational. TCP’s reliance on “timeouts and retries to maintain liveness” is a reaction to a medium that is fundamentally unreliable. The result is a system that creates a “mess the application must discover and then clean up”. This provides the definitive motivation for the Daedaelus architecture, which achieves Truncated Tail Latency and guaranteed service by building determinism and reliability into the fabric itself, rather than leaving it as an exercise for higher-level protocols.
Final Proof: The Inherent Scaling Limits of a Contended Medium
Final Proof: The Inherent Scaling Limits of a Contended Medium
This final notebook provides the most direct and conclusive "Code as Proof" of the fundamental performance limitations of classic Ethernet . By implementing a minimalist, slot - based simulation, it deliberately strips away the complexities of higher - level protocols to isolate and analyze the core contention mechanism itself . The singular goal of this analysis is to computationally reproduce the theoretical relationship between the number of contending stations and the overall efficiency of the shared channel .
The simulation produces two key visualizations that tell a complete story:
The simulation produces two key visualizations that tell a complete story:
◼
Timeline of Shared Ether Contention: This GANTT-style chart provides a clear, macroscopic view of how the passive broadcast medium is arbitrated over time. It visually represents the time-division multiplexing that emerges from the contention protocol, where only one station can successfully transmit at any given time.
◼
Channel Utilization vs. Station Count: This plot is the central finding of our entire analysis of the classic model. It is a computational verification of the performance curves first theorized in the foundational 1976 Ethernet paper. The plot provides definitive, empirical evidence that as the number of contending stations increases, the overall utilization of the channel degrades.
This demonstrates, unequivocally, the core architectural limitation: “at some point the Ether will be so busy that additional stations will just divide more finely the already inadequate bandwidth”. Having computationally proven that the performance of a system based on “controlled statistical arbitration” is fundamentally capped, we now turn to the Daedaelus architecture, which is designed from first principles to escape these limits.
This demonstrates, unequivocally, the core architectural limitation: “at some point the Ether will be so busy that additional stations will just divide more finely the already inadequate bandwidth”. Having computationally proven that the performance of a system based on “controlled statistical arbitration” is fundamentally capped, we now turn to the Daedaelus architecture, which is designed from first principles to escape these limits.
Conclusive Analysis: The Performance Limitations of a Contended Medium
Conclusive Analysis: The Performance Limitations of a Contended Medium
This notebook presents the final, conclusive results of our investigation into the performance of the classic CSMA/CD protocol. It combines a high-fidelity, slot-based simulation with a comprehensive analysis dashboard, serving as our capstone “Code as Proof” that quantifies the inherent costs and limitations of a system based on controlled statistical arbitration.
The dashboard provides a multi-faceted view of the network’s performance, validating our analysis and making the definitive case for a new architecture:
The dashboard provides a multi-faceted view of the network’s performance, validating our analysis and making the definitive case for a new architecture:
◼
Packet Latency Analysis: This section provides the end-user perspective on the system’s performance. The latency histogram and associated statistics (min, max, mean, std dev) provide a clear, quantitative measure of the unbounded tail latency that emerges from the contention protocol. The high variance in delivery time is a direct consequence of the unpredictable number of collisions and backoffs each packet might endure.
◼
Network Activity: The Channel State Over Time plot offers a macroscopic view of the shared Ether. The rapid, chaotic switching between Idle, Busy, and Collision states is the visual signature of a system that lacks deterministic control. Each red spike represents a moment of wasted channel time where multiple stations attempted to transmit simultaneously.
◼
Efficiency Comparison: This plot provides the final, damning evidence. It directly compares the simulated efficiency achieved in the model against a theoretical maximum. The gap between the two represents the unavoidable performance penalty paid for using a probabilistic arbitration scheme. It is a direct measure of the “mess” created by the protocol itself.
Having now demonstrated, through a series of increasingly sophisticated simulations, that a system built on a shared, contended medium is fundamentally inefficient and unpredictable, we have established the necessity for a new approach. This concludes our analysis of the classic model and sets the stage for the introduction of the Daedaelus architecture, which is designed from first principles to provide guaranteed service and Truncated Tail Latency by eliminating contention itself.
This Mathematica code provides a simulation of a Half-Duplex Ethernet network using the CSMA/CD protocol, aiming to demonstrate the inherent inefficiencies and latency issues of conventional networking under contention. It meticulously models aspects like carrier sensing, binary exponential backoff for retransmissions, and collision detection to showcase how increasing the number of active stations on a shared medium dramatically reduces overall efficiency and increases round-trip latency, often leading to a “long tail” of unpredictable delays. By analyzing this classic model, we lay the groundwork for understanding why the Daedaelus approach, with its focus on “truncated tail latency” and “atomic protocols” that eliminate heartbeats and retries, offers a superior path for secure, reliable, distributed computing, particularly on the edge where predictable performance is paramount.
This Mathematica code simulates a CSMA/CD Ethernet network to analyze its performance under varying load and demonstrate the limitations of conventional networking. It meticulously tracks packet generation, collisions, backoff algorithms, and retransmissions, providing insights into network efficiency and the distribution of round-trip times. The simulation highlights how increasing network traffic leads to a rise in collisions and queue depths, causing unpredictable latency variations and reduced throughput, a critical problem that our Daedaelus architecture seeks to overcome through a fundamentally different approach to distributed communication. By precisely modeling these traditional challenges, the “Code as Proof” methodology reinforces the necessity of our “Truncated Tail Latency” protocol and the overall “Open Atomic Ethernet” vision, which aims to provide predictable, “exactly-once semantics” without relying on problematic timeouts and retries.
This Mathematica code provides an agent-based simulation of a Carrier Sense Multiple Access with Collision Detection (CSMA/CD) Ethernet network, offering a detailed look into the dynamics of a shared communication medium. The simulation models individual stations and their behavior as they attempt to transmit packets on a single networkState (Ether), including mechanisms like queueing of data, sensing the medium’s state (IDLE, BUSY, COLLISION), and implementing binary exponential backoff to handle collisions. It dynamically tracks events such as TX_START, TX_SUCCESS, and COLLISION in an eventLog, allowing for precise measurement of network efficiency and collisionRate. By visualizing the “Ethernet Channel Activity” over time and presenting key metricsPanel statistics, this simulation serves as a concrete demonstration of how contention and packet loss inherently limit the performance of traditional Ethernet. This directly underpins the Daedaelus critique that “Bandwidth Works in Practice, not in Theory” and highlights the need for fundamentally reliable, deterministic protocols that move beyond these probabilistic limitations to achieve true “exactly-once semantics” in distributed systems.
This Mathematica code simulates a simplified CSMA/CD Ethernet network to analyze its efficiency and slot utilization. It models the core behaviors of stations contending for a shared medium, including carrier sensing, deferring transmission, experiencing collisions, and employing binary exponential backoff for retransmission. After the simulation, it visualizes the proportion of time the shared medium spends in idle, successful transmission, or collision states through a pie chart, and compares the simulated efficiency against the theoretical maximum efficiency (1/e) for slotted Aloha-like systems using a bar chart. This simulation serves as a didactic tool to illustrate the fundamental performance characteristics of CSMA/CD Ethernet, highlighting the inherent limitations that Daedaelus seeks to overcome with its “Open Atomic Ethernet” philosophy, which prioritizes predictable, low-latency communication over statistically-managed bandwidth sharing.
This Mathematica code creates an interactive “Ethernet Performance Analysis” tool based on the seminal Metcalfe & Boggs (1976) Ethernet paper, allowing users to explore the theoretical efficiency of a shared-medium Ethernet under varying network parameters. The core EthernetEfficiency function calculates efficiency based on packet size, channel capacity, slot time, and the number of continuously queued stations, demonstrating how contention and transmission dynamics influence overall performance. Through a user-friendly Manipulate interface with adjustable sliders, the tool dynamically displays current efficiency and generates real-time plots showing the relationship between efficiency and the number of active stations, as well as efficiency and packet size. This interactive analysis visually underscores the inherent limitations of traditional Ethernet’s statistical approach to managing a shared medium, reinforcing the fundamental problems that our Daedaelus “Open Atomic Ethernet” philosophy seeks to overcome by moving towards more deterministic and predictable communication methods.
◼
This Mathematica code generates an interactive “Ethernet Performance Model (Metcalfe & Boggs, 1976)” to visually demonstrate the theoretical efficiency and inherent limitations of traditional Ethernet. It calculates efficiency based on factors like packet size, channel capacity, slot time, and the number of queued stations, directly applying the foundational Metcalfe-Boggs equations to illustrate network behavior under contention. Through an intuitive user interface with adjustable parameters, the tool dynamically updates the current efficiency and plots its relationship with varying packet sizes and numbers of active stations. This “Code as Proof” approach allows for real-time exploration of how traditional Ethernet’s statistical management of a shared medium leads to performance compromises, thereby highlighting the necessity of the Daedaelus “Open Atomic Ethernet” philosophy for achieving predictable and reliable communication in distributed systems.
This Mathematica code simulates a slotted Ethernet network using the CSMA/CD protocol, meticulously modeling station behavior, packet transmissions, and collision resolution via binary exponential backoff. The SimulateEthernet function precisely tracks successful transmissions, collision events, and idle time slots over a specified duration to compute the network’s simulated efficiency. The output includes a timeline plot illustrating the dynamic interplay of successes, collisions, and idle periods, along with a bar chart directly comparing the simulated efficiency against the theoretical efficiency predicted by the Metcalfe-Boggs model. This comprehensive simulation serves as a critical “Code as Proof” artifact, visually demonstrating the inherent performance and reliability limitations of traditional Ethernet’s statistical approach to channel access, thereby underscoring the foundational problems that the Daedaelus “Open Atomic Ethernet” aims to resolve by enabling predictable, “exactly-once semantics” and eliminating “unbounded tail latency”.
◼
This Mathematica code creates an interactive “ETHERNET CONTENTION MODEL” that visualizes the theoretical performance of a shared-medium Ethernet network based on CSMA/CD principles. It features functions to calculate network efficiency and collision probability based on parameters such as packet size, channel capacity, slot time, and the number of active stations. The interactive interface allows users to adjust these parameters dynamically, observing real-time updates of performance metrics like efficiency, collision probability, and average wait slots. The tool also presents three plots illustrating the relationships between efficiency and station count, efficiency and packet size, and collision probability versus station count. This “Code as Proof” tool visually demonstrates the inherent limitations of traditional Ethernet’s statistical approach to managing shared bandwidth, reinforcing the Daedaelus philosophy that such best-effort, collision-prone mechanisms lead to “unbounded tail latency” and “silent corruption of data structures”, thereby necessitating our “Open Atomic Ethernet” standard for predictable and reliable distributed computing.
This Mathematica code offers a comprehensive simulation and theoretical analysis of Ethernet efficiency across varying numbers of contending stations, shedding light on the impact of CSMA/CD on channel utilization and performance. The simulateEthernet function models station behavior, including packet transmission, collision detection, and binary exponential backoff, meticulously tracking successful transmissions, collision events, and idle time over a defined duration. The simulation’s results are then compared against the theoreticalEfficiency derived from the Metcalfe-Boggs model, with visualizations provided through bar charts that illustrate the Ethernet’s efficiency versus the number of stations, and a breakdown of channel utilization into idle and collision times. Additionally, a plot showcases the theoretical efficiency boundaries, including the 1/e asymptote, underscoring the fundamental limits of this shared-medium protocol. This “Code as Proof” approach vividly demonstrates the inherent statistical and limited nature of traditional Ethernet, reinforcing the Daedaelus mission to solve “fundamental problems in distributed systems” where unpredictable outcomes and “unbounded tail latency” arise from protocols reliant on “irreversible smash and restart of Shannon information”. This analysis further emphasizes the critical need for the “Open Atomic Ethernet” standard, which aims to provide predictable, “exactly-once semantics”.
◼
This detailed simulation of Ethernet’s CSMA/CD mechanism highlights the critical limitations of shared-medium networks as envisioned by Metcalfe and Boggs, directly challenging the industry’s historical reliance on raw bandwidth as the primary performance metric. The model vividly illustrates how increasing the number of active stations leads to a disproportionate rise in collisions and subsequent retransmissions through exponential backoff, consuming valuable channel time and drastically reducing effective throughput. This inherent probabilistic nature of traditional Ethernet creates unpredictable “tail latency” and makes “exactly-once semantics impossible,” issues that persist in modern distributed databases despite increased link speeds.
◼
The demonstrated inefficiencies, particularly the significant portion of time lost to idle periods and collisions, directly motivate the Daedaelus mission to “Architect the Future with Enduring Excellence” by moving beyond these foundational constraints. Our “Open Atomic Ethernet” standard aims to eliminate the “irreversible smash and restart of Shannon information to recover from failures” by implementing “time-reversible constructors” and a “Truncated Tail Latency” protocol that inherently knows the outcome of a transaction without relying on unreliable heartbeats or timeouts. This fundamental shift from bandwidth-multiplexing to “transactional capacity” multiplexing, managed by a “Graph Virtual Machine” and operating on an “N2N Lattice,” promises to deliver the secure, reliable, and predictable distributed computing essential for edge environments, digital twins, and quantum interfaces.
This Mathematica code generates an interactive “Ethernet Performance Analysis” tool based on the seminal Metcalfe & Boggs (1976) Ethernet Model, designed to illustrate how network parameters influence the theoretical efficiency of a shared communication medium. The tool calculates efficiency based on factors like packet size, channel capacity, slot time, and the number of queued stations, directly applying the foundational Metcalfe-Boggs equations to illustrate network behavior under contention. Through an intuitive user interface with adjustable sliders, the tool dynamically updates the current efficiency and plots its relationship with varying packet sizes and numbers of active stations. A performance table is also included, providing a tabular summary of theoretical efficiency for various parameter combinations, assuming an “overloaded network”. This “Code as Proof” artifact enables a deep, visual, and quantitative exploration of the theoretical limits and behaviors of classic Ethernet, reinforcing the Daedaelus project’s foundational critique of traditional network design and its reliance on probabilistic contention management, which contributes to “unbounded tail latency” and hinders “exactly-once semantics”.
This “Code as Proof” demonstration of Ethernet’s limitations directly informs the core tenets of the Daedaelus philosophy, particularly the emphasis on “Token Dynamics” and “Reversible Subtransactions”. Unlike the simulated environment where collisions necessitate statistical “retransmission backoff” and packets are effectively “lost” and “restarted,” the Daedaelus architecture is designed to manage information through “conserved quantities” and “time-reversible constructors”. This fundamental shift avoids the “irreversible smash and restart of Shannon information to recover from failures”, which is a pervasive problem in conventional networks and leads to silent data corruption and unpredictable latency. By contrast, our “Graph Virtual Machine (GVM)” and “Neighbor to Neighbor (N2N) Lattice” provide a framework where transactional integrity is inherently maintained, ensuring “exactly-once semantics” and predictable performance, even in the face of network perturbations.
◼
This Mathematica code generates an “ETHERNET PERFORMANCE VISUALIZER” based on the Metcalfe & Boggs (1976) Ethernet Model, serving as an interactive tool to explore the theoretical efficiency of a shared communication channel. It utilizes core functions to calculate efficiency, drawing upon concepts of successful slot acquisition and average waiting slots, given parameters like packet size, channel capacity, slot time, and the number of continuously queued stations. The interactive interface allows users to dynamically adjust these parameters, observing in real-time how current efficiency changes and visualizing the impact on network performance through plots that show efficiency versus station load. A comprehensive table of efficiency values for various packet sizes and queued station counts is also displayed, mirroring the type of data presented in the original Metcalfe & Boggs paper.
◼
This tool serves as a powerful “Code as Proof” artifact, enabling a deep, visual, and quantitative exploration of the theoretical limits and behaviors of classic Ethernet’s probabilistic contention model. By explicitly demonstrating how network efficiency is constrained by factors such as increasing station load and packet size, it reinforces the Daedaelus project’s foundational critique of traditional network design. The model highlights that reliance on statistical arbitration for channel access inherently leads to performance compromises that manifest as unpredictable “unbounded tail latency” and ultimately hinder the ability to guarantee “exactly-once semantics” in distributed systems.
◼
The problems illuminated by this visualizer, such as the reduction in efficiency as more stations contend for the medium, are precisely what the Daedaelus “Open Atomic Ethernet” standard aims to solve. By moving beyond the “irreversible smash and restart of Shannon information to recover from failures” that characterize conventional networks, Daedaelus proposes a paradigm shift towards deterministic control. This is achieved through “time-reversible constructors” and a “Truncated Tail Latency” protocol that inherently knows transaction outcomes without problematic heartbeats or timeouts.
◼
Ultimately, this interactive model underscores the critical need for a new approach to network architecture, one that prioritizes predictable and reliable communication over raw, best-effort bandwidth. The Daedaelus “Graph Virtual Machine (GVM)” and “Neighbor to Neighbor (N2N) Lattice” are designed to enable this fundamental transformation, providing a framework where transactional integrity is maintained and network performance is consistently deterministic, which is essential for use-cases like Transaction Processing, Digital Twins, and Multiplayer Games on the edge.
This Mathematica code creates a sophisticated “ETHERNET PERFORMANCE VISUALIZER (Metcalfe-Boggs Model)” that provides a multi-dimensional analysis of Ethernet efficiency, showcasing how performance is affected by packet size and the number of active stations. The tool allows users to interactively adjust parameters like minimum/maximum packet size, maximum stations, channel capacity, and slot time. It dynamically displays the theoretical efficiency based on the Metcalfe-Boggs equations and presents this performance through a 3D surface plot, contour plots, and 2D slice plots that illustrate efficiency versus packet size and efficiency versus the number of stations. This visualizer acts as a crucial “Code as Proof” artifact, demonstrating the inherent limitations and complex interdependencies within the classic Ethernet contention model.
By allowing users to explore the efficiency surface across varying loads and packet sizes, this tool reinforces the Daedaelus project’s foundational critique of traditional, statistically-managed networks. It highlights how these conventional approaches are prone to unpredictable behavior and “unbounded tail latency”, ultimately failing to provide the “exactly-once semantics” required for modern distributed systems. The visualizer thus underscores the imperative for a paradigm shift towards the deterministic and reliable communication offered by the Daedaelus “Open Atomic Ethernet” standard, which seeks to overcome the limitations of “irreversible smash and restart of Shannon information to recover from failures” by implementing mechanisms like the “Graph Virtual Machine (GVM)” and “Neighbor to Neighbor (N2N) Lattice”.
◼
This Mathematica code creates a sophisticated “Ethernet Performance Model (Metcalfe & Boggs, 1976)” that provides a multi-dimensional analysis of Ethernet efficiency, showcasing how performance is affected by packet size and the number of active stations. The tool allows users to interactively adjust parameters like minimum/maximum packet size, maximum stations, channel capacity, and slot time. It dynamically displays the theoretical efficiency based on the Metcalfe-Boggs equations and presents this performance through a 3D surface plot, contour plots, and 2D slice plots that illustrate efficiency versus packet size and efficiency versus the number of stations. This visualizer acts as a crucial “Code as Proof” artifact, demonstrating the inherent limitations and complex interdependencies within the classic Ethernet contention model.
◼
By allowing users to explore the efficiency surface across varying loads and packet sizes, this tool reinforces the Daedaelus project’s foundational critique of traditional, statistically-managed networks. It highlights how these conventional approaches are prone to unpredictable behavior and “unbounded tail latency”, ultimately failing to provide the “exactly-once semantics” required for modern distributed systems. The visualizer thus underscores the imperative for a paradigm shift towards the deterministic and reliable communication offered by the Daedaelus “Open Atomic Ethernet” standard, which seeks to overcome the limitations of “irreversible smash and restart of Shannon information to recover from failures” by implementing mechanisms like the “Graph Virtual Machine (GVM)” and “Neighbor to Neighbor (N2N) Lattice”.
◼
This Mathematica code provides a detailed simulation of a CSMA/CD Ethernet network, analyzing its channel utilization, efficiency, and packet delay under specified parameters. The simulation models individual stations, their packet queues, collision counts, and backoff timers, capturing the dynamic interplay of contention for a shared medium on a slot-by-slot basis. It meticulously tracks successful transmissions, total collisions, and the end-to-end delay of packets, offering quantitative insights into the network’s behavior. The output includes a bar chart visualizing the overall “Ethernet Channel Utilization,” breaking down time spent in idle, successful transmission, and collision states, along with numerical summaries of key performance metrics like efficiency, average delay, and collision rate.
This simulation serves as a vital “Code as Proof” artifact, clearly demonstrating the inherent inefficiencies and unpredictable delays that arise from the statistical contention resolution of traditional Ethernet. It directly supports the Daedaelus project’s foundational critique that conventional networks, by relying on mechanisms prone to “unbounded tail latency” and “retry storms,” inevitably fail to provide “exactly-once semantics”. This “silent corruption of data structures and loss of data” is a persistent problem in distributed databases that traditional Ethernet’s “irreversible smash and restart of Shannon information” cannot overcome. By vividly illustrating these fundamental limitations, the simulation underscores the critical necessity for the “Open Atomic Ethernet” standard, which aims to establish a truly reliable and deterministic communication fabric.
◼
This Mathematica code provides a comparative analysis of Ethernet efficiency, simulating a CSMA/CD network and juxtaposing its performance with the theoretical model proposed by Metcalfe & Boggs (1976). The simulation explicitly models the dynamic interactions of multiple contending stations, offering a “Code as Proof” demonstration of real-world network behavior versus idealized predictions. The simulateEthernet function emulates the CSMA/CD protocol, tracking channel busy time, contention, and binary exponential backoff for a given number of stations, packet size, channel capacity, and slot time. It computes the simulated efficiency as the ratio of successful transmission time to total simulated time.
◼
The theoreticalEfficiency function, on the other hand, calculates the expected Ethernet efficiency based on the mathematical Metcalfe-Boggs model, considering the number of stations, packet size, channel capacity, and slot time. The generateEfficiencyPlot function then orchestrates both the simulation and theoretical calculations across a range of stations and visually compares their performance in a line plot. This comparative visualization graphically illustrates that while the simulation (modeling realistic binary backoff) generally follows the trend of the theoretical Metcalfe-Boggs model, there can be subtle differences, especially at lower station counts, where the simulated behavior might be slightly less efficient due to the discrete nature of the backoff algorithm or other simulated dynamics. This analysis directly reinforces the Daedaelus project’s critique of traditional Ethernet’s reliance on statistical and best-effort mechanisms. It highlights that such protocols lead to inherent inefficiencies and unpredictable performance, contributing to “unbounded tail latency” and preventing “exactly-once semantics” in distributed systems. By meticulously dissecting these limitations, the code underscores the imperative for the “Open Atomic Ethernet” standard, which seeks to provide truly reliable and deterministic communication.
◼
This Mathematica code creates an “Ethernet Performance Simulator” that visually demonstrates the dynamics and efficiency of a CSMA/CD network, explicitly referencing the foundational work of Metcalfe and Boggs (1976). The simulator provides an interactive environment to explore how varying network parameters impact theoretical and actual performance.
◼
This simulation serves as a vital “Code as Proof” artifact, clearly demonstrating the inherent inefficiencies and unpredictable delays that arise from the statistical contention resolution of traditional Ethernet. It directly supports the Daedaelus project’s foundational critique that conventional networks, by relying on mechanisms prone to “unbounded tail latency” and “retry storms,” inevitably fail to provide “exactly-once semantics”. This “silent corruption of data structures and loss of data” is a persistent problem in distributed databases that traditional Ethernet’s “irreversible smash and restart of Shannon information” cannot overcome. By vividly illustrating these fundamental limitations, the simulation underscores the critical necessity for the “Open Atomic Ethernet” standard, which aims to establish a truly reliable and deterministic communication fabric.
This Mathematica code creates an “Ethernet Performance Explorer,” an interactive tool designed to illustrate the theoretical efficiency of a shared-medium Ethernet network based on the Metcalfe & Boggs (1976) model. The tool utilizes core functions that calculate efficiency based on successful slot acquisition probability and average waiting slots, given parameters such as packet size and the number of active stations. Through its interactive sliders, users can dynamically adjust packet size and the number of active stations, observing real-time updates of current efficiency and visualizing its impact through plots of efficiency versus network load. Additionally, the explorer features buttons to toggle a detailed performance table, providing efficiency values for various packet size and station count combinations, and a 3D plot of the Ethernet efficiency surface.
This “Ethernet Performance Explorer” serves as a fundamental “Code as Proof” artifact, enabling a direct and intuitive exploration of the theoretical underpinnings and inherent limitations of Ethernet’s probabilistic contention model. It explicitly demonstrates how increasing network load and fixed slot times lead to reduced efficiency and unpredictable performance, reinforcing the Daedaelus project’s core critique: conventional networking’s inability to provide “exactly-once semantics” and avoid “unbounded tail latency”. This visualizer thus underscores the imperative for a new paradigm, such as the “Open Atomic Ethernet” standard, which aims to provide predictable and reliable communication by moving beyond these fundamental, probabilistic constraints.
◼
This Mathematica code provides a detailed simulation of an Ethernet network operating under the CSMA/CD protocol, offering a comprehensive analysis of its performance by comparing simulated results with theoretical predictions. The simulation models individual stations, their packet queues, collision counts, and backoff timers, capturing the dynamic interplay of contention for a shared medium on a slot-by-slot basis. It meticulously tracks successful transmissions, total collisions, and the end-to-end delay of packets, offering quantitative insights into the network’s behavior. The output includes a bar chart visualizing the overall “Ethernet Channel Utilization,” breaking down time spent in idle, successful transmission, and collision states, along with numerical summaries of key performance metrics like efficiency, average delay, and collision rate.
◼
This simulation serves as a vital “Code as Proof” artifact, clearly demonstrating the inherent inefficiencies and unpredictable delays that arise from the statistical contention resolution of traditional Ethernet. It directly supports the Daedaelus project’s foundational critique that conventional networks, by relying on mechanisms prone to “unbounded tail latency” and “retry storms,” inevitably fail to provide “exactly-once semantics”. This “silent corruption of data structures and loss of data” is a persistent problem in distributed databases that traditional Ethernet’s “irreversible smash and restart of Shannon information” cannot overcome. By vividly illustrating these fundamental limitations, the simulation underscores the critical necessity for the “Open Atomic Ethernet” standard, which aims to establish a truly reliable and deterministic communication fabric.
This Mathematica code creates an “Ethernet Performance Simulator” that visually demonstrates the dynamics and efficiency of a CSMA/CD network, explicitly referencing the foundational work of Metcalfe and Boggs (1976). The simulator provides an interactive environment to explore how varying network parameters impact theoretical and actual performance.
This simulation serves as a vital “Code as Proof” artifact, clearly demonstrating the inherent inefficiencies and unpredictable delays that arise from the statistical contention resolution of traditional Ethernet. It directly supports the Daedaelus project’s foundational critique that conventional networks, by relying on mechanisms prone to “unbounded tail latency” and “retry storms,” inevitably fail to provide “exactly-once semantics”. This “silent corruption of data structures and loss of data” is a persistent problem in distributed databases that traditional Ethernet’s “irreversible smash and restart of Shannon information” cannot overcome. By vividly illustrating these fundamental limitations, the simulation underscores the critical necessity for the “Open Atomic Ethernet” standard, which aims to establish a truly reliable and deterministic communication fabric.
The visual and interactive nature of this simulator is crucial in making the often-abstract concepts of network contention concrete, directly supporting the arguments made in “Bandwidth Works in Practice, not in Theory”. It allows observers to witness firsthand how packet collisions, subsequent backoff periods, and retransmissions consume valuable channel time, leading to unpredictable delays that cannot be mitigated simply by increasing raw bandwidth. This phenomenon directly threatens the “epistemic state” of distributed systems, leading to “grey failures” where the outcome of a transaction remains ambiguous, a problem that cannot be solved by conventional timeouts and retries.
◼
The problems highlighted by this simulation are precisely what the Daedaelus architecture is designed to overcome, moving beyond merely patching over network unreliability. Our “Truncated Tail Latency” protocol knows if a transaction succeeded or failed without relying on heartbeats or timeouts, eliminating the very “retry storms” and “unbounded tail latency” that the simulator’s exponential backoff demonstrates. This is achieved through “time-reversible constructors” and “Reversible Subtransactions,” which ensure that “conserved quantities” of information are never truly lost, fundamentally departing from the “irreversible smash and restart of Shannon information” that defines conventional approaches.
◼
Furthermore, the simulated chaotic contention on a shared medium directly contrasts with the deterministic coordination facilitated by the Daedaelus “Graph Virtual Machine (GVM)” and “Neighbor to Neighbor (N2N) Lattice”. Rather than allowing stations to statistically battle for channel access, the GVM builds and tears down “named graph relationships” to deterministically schedule interactions, ensuring predictable throughput and latency. This approach also overcomes the fragility of “fixed Cartesian coordinate systems” by enabling highly dynamic “Graph (Network) Automata Foundations” that adapt to network changes and failures using “Local Observer View (LOV) information only”.
In essence, this simulator serves as a compelling argument for the paradigm shift advocated by Daedaelus: from a best-effort, statistically managed network to a formally verifiable, open standard. By making the limitations of current Ethernet evident, it underscores the urgent need for a network infrastructure that can provide “guaranteed service” and “lower latency, fewer errors, and greater scalability”, thereby enabling truly secure, reliable, and predictable distributed computing on the edge for critical use-cases like Transaction Processing, Digital Twins, and Multiplayer Games.
This Mathematica code conducts a detailed comparative analysis of Ethernet efficiency, contrasting its analytical (theoretical) performance with simulated results and validating them against data from the original Metcalfe & Boggs paper. This serves as a multi-faceted “Code as Proof” demonstration of Ethernet’s inherent characteristics and limitations. The code utilizes fixed model constants for slot time (16 µs) and channel capacity (3 Mbps) to align with the historical context of Ethernet’s original specifications. It then calculates theoretical efficiency using the classical Metcalfe-Boggs formulas, considering the number of stations and packet size.
◼
Complementing the theoretical analysis, the SimulateContention function implements a Monte Carlo simulation of Ethernet’s contention process, empirically deriving efficiency by simulating successful slot acquisitions and accumulating time lost to contention for a given number of stations and packet size. The GenerateEfficiencyPlots function orchestrates this comparative analysis, producing three distinct plots: one comparing analytical and simulated efficiency against the number of stations, another showing the same comparison against packet size, and a third validating the model against historical data from the original Metcalfe & Boggs paper. These visualizations vividly illustrate that while larger packets generally improve efficiency, increasing the number of active stations inevitably leads to performance degradation, a core problem that Daedaelus addresses.
◼
This “Code as Proof” analysis underpins our foundational critique of conventional networking, which contributes to “unbounded tail latency” and impedes “exactly-once semantics” due to its reliance on “irreversible smash and restart of Shannon information”. The demonstrated statistical nature and inherent limitations of Ethernet’s contention-based access, as shown in the plots, reinforce the Daedaelus mission to develop an “Open Atomic Ethernet” standard that delivers predictable and reliable communication by moving beyond these probabilistic constraints. This shift is crucial for addressing “fundamental problems in distributed systems” and enabling use-cases like Transaction Processing and Digital Twins with verifiable guarantees.
This Mathematica code provides a detailed simulation of an Ethernet network operating under the CSMA/CD protocol, offering a comprehensive analysis of its performance by comparing simulated results with theoretical predictions. The simulation models individual stations, their packet queues, collision counts, and backoff timers, capturing the dynamic interplay of contention for a shared medium on a slot-by-slot basis. It meticulously tracks successful transmissions, total collisions, and the end-to-end delay of packets, offering quantitative insights into the network’s behavior. The output includes a bar chart visualizing the overall “Ethernet Channel Utilization,” breaking down time spent in idle, successful transmission, and collision states, along with numerical summaries of key performance metrics like efficiency, average delay, and collision rate.
This simulation serves as a vital “Code as Proof” artifact, clearly demonstrating the inherent inefficiencies and unpredictable delays that arise from the statistical contention resolution of traditional Ethernet. It directly supports the Daedaelus project’s foundational critique that conventional networks, by relying on mechanisms prone to “unbounded tail latency” and “retry storms,” inevitably fail to provide “exactly-once semantics”. This “silent corruption of data structures and loss of data” is a persistent problem in distributed databases that traditional Ethernet’s “irreversible smash and restart of Shannon information” cannot overcome. By vividly illustrating these fundamental limitations, the simulation underscores the critical necessity for the “Open Atomic Ethernet” standard, which aims to establish a truly reliable and deterministic communication fabric.
This Mathematica code provides a visual simulation of an Ethernet network operating under the Metcalfe & Boggs model, illustrating the dynamic process of packet transmission, propagation, and collision resolution along a physical cable. The simulation focuses on the interaction of multiple stations contending for a shared medium in a time-varying environment. Key parameters like cable length, propagation speed, data rate, slot time, and packet size define the physical characteristics of the simulated network. Stations are initialized with random positions, and packets are created with source and destination information, allowing the simulator to track their journey and status within the network.
◼
The simulateEthernet function drives the core logic, meticulously modeling channel contention, collision detection, and successful packet delivery. When multiple packets attempt to transmit simultaneously, a collision is detected, and involved packets are marked “COLLIDED”. The source stations of these collided packets then increment their collision count and enter a binary exponential backoff state, scheduling a retry in the future. Conversely, successful transmissions see packets marked “DELIVERED,” with the source station generating a new packet and resetting its backoff count. This intricate time-step progression and event management is visually represented through an animation, where functions like drawCable, drawStations, and drawPackets render the physical layer interactions in real-time, showcasing the packets’ movement and collisions along the cable.
◼
This interactive simulation serves as a compelling “Code as Proof” artifact, vividly demonstrating the physical realities of packet propagation, contention, and collisions on a shared Ethernet medium. It highlights how the probabilistic nature of CSMA/CD leads to unpredictable “unbounded tail latency” and makes “exactly-once semantics impossible”. By visually dissecting these fundamental limitations, the simulation underscores the critical necessity for the “Open Atomic Ethernet” standard, which aims to provide predictable and reliable communication by moving beyond these inherent probabilistic constraints and preventing the “irreversible smash and restart of Shannon information”. This transformation is essential for the future of distributed systems, especially in demanding applications like Transaction Processing and Digital Twins.
This Mathematica code constructs an interactive “Ethernet Performance Model” based on the foundational work of Metcalfe & Boggs (1976), providing a dynamic and visual platform to explore the theoretical efficiency of a shared-medium Ethernet network. The core of the model is the EthernetEfficiency function, which calculates efficiency by considering the probability of successful slot acquisition and the average waiting time due to contention. This function takes as input the number of continuously queued stations (Q), packet size (P), channel capacity (C), and slot time (T).
The Manipulate interface creates a user-friendly environment with sliders that allow real-time adjustment of these “Ethernet Parameters”. Users can control the number of Queued stations (Q), Packet size (P), Channel capacity (C), and Slot time (T), observing their immediate impact on network performance. A dedicated “Current Parameters” section dynamically displays these input values along with the calculated Efficiency (E), highlighting in red if the efficiency drops below a critical threshold of 70%.
◼
The tool provides a comprehensive “Performance Analysis” through three interactive plots: “Efficiency vs. Station Load” illustrates how efficiency changes as the number of queued stations varies, demonstrating the impact of increased contention. “Efficiency vs. Packet Size” shows how efficiency generally improves with larger packet sizes, as transmission overhead is amortized over more data. Finally, a “3D Efficiency Surface” plot provides a holistic view of how both queued stations and packet size collectively influence network efficiency.
◼
This “Ethernet Performance Model” serves as a vital “Code as Proof” artifact, designed to visually and quantitatively demonstrate the inherent limitations of traditional Ethernet’s statistical contention resolution. It reinforces the Daedaelus project’s foundational critique that conventional networks, by relying on such probabilistic mechanisms, inevitably lead to unpredictable “unbounded tail latency” and fail to provide “exactly-once semantics”. By clearly illustrating these fundamental problems, the model underscores the critical necessity for the “Open Atomic Ethernet” standard, which aims to establish a truly reliable and deterministic communication fabric to address the persistent issues of data corruption and transaction failures in distributed systems.
This Mathematica code creates an interactive “Ethernet Efficiency Surface” tool, allowing users to explore the theoretical efficiency of a shared-medium Ethernet network based on the Metcalfe & Boggs model. The tool visualizes how changes in network parameters, such as Link Capacity, Slot Time, Min Packet Size, Max Packet Size, Max Queued Stations, and a selectedQ for a 2D plot, collectively influence the overall network efficiency.
The core of the model is the eff function, which calculates efficiency based on the probability of successful slot acquisition (A) and the average waiting time (W) due to contention. The interface features a prominent 3D plot displaying the “Ethernet Efficiency Surface,” where efficiency is mapped across varying packet sizes and numbers of queued stations, providing a holistic view of performance. Below this, a 2D plot shows how efficiency changes specifically with Packet Size for a user-selected number of Station(s) Queued, allowing for focused analysis of individual parameter effects.
This tool serves as a “Code as Proof” artifact, vividly demonstrating the inherent limitations of traditional Ethernet’s statistical contention resolution. It highlights how the probabilistic nature of CSMA/CD leads to unpredictable “unbounded tail latency” and makes “exactly-once semantics impossible”. By visually dissecting these fundamental limitations across a range of operating conditions, the simulation underscores the critical necessity for the “Open Atomic Ethernet” standard, which aims to provide predictable and reliable communication by moving beyond these inherent probabilistic constraints and preventing the “irreversible smash and restart of Shannon information” that plagues conventional networks.
This Mathematica code provides an interactive “Ethernet Performance Model” that demonstrates the theoretical efficiency and throughput of a shared-medium Ethernet network operating under the CSMA/CD protocol. The tool allows users to explore how varying network parameters impact overall performance, offering a “Code as Proof” perspective on the inherent challenges of traditional Ethernet.
◼
The model incorporates fundamental Ethernet parameters such as c (channel capacity of 3 Mbps), slotTime (16 µs), and maxPacket (4000 bits). It defines core functions: A[q_] calculates the probability of successful slot acquisition, W[q_] determines the average waiting slots due to contention, and Efficiency[p_, q_] computes the theoretical efficiency based on packet size (p) and the number of active stations (q). Additionally, a SimulateCollisions function provides a simplified Monte Carlo method to count idle, successful, and collision slots, offering a statistical view of channel events.
◼
The Manipulate interface presents interactive sliders for adjusting the Active Stations (nStations) and Packet Size (packetSize), enabling dynamic exploration of network conditions. The output includes a grid displaying simulated station statuses (e.g., “Colliding” or “Transmitting”), alongside a 2D plot showing “Ethernet Efficiency vs. Load” and a 3D plot visualizing “Network Throughput” as a function of both stations and packet size. Theoretical maximum efficiencies are also calculated and displayed for various scenarios, such as slot-sized packets and large packets under different loads, and a TableForm provides a detailed breakdown of efficiency across multiple packet sizes and queued station counts.
This comprehensive “Ethernet Performance Model” serves as a powerful “Code as Proof” artifact, designed to visually and quantitatively demonstrate the inherent limitations of traditional Ethernet’s statistical contention resolution. It reinforces the Daedaelus project’s foundational critique that conventional networks, by relying on such probabilistic mechanisms, inevitably lead to unpredictable “unbounded tail latency” and fail to provide “exactly-once semantics”. By clearly illustrating these fundamental problems, the model underscores the critical necessity for the “Open Atomic Ethernet” standard, which aims to establish a truly reliable and deterministic communication fabric to address the persistent issues of data corruption and transaction failures in distributed systems.
This Mathematica code generates an “Ethernet Performance Model” based on the foundational Metcalfe & Boggs (1976) paper, providing an interactive visualization tool to explore the theoretical efficiency of a shared Ethernet medium. The model allows users to dynamically adjust key network parameters and observe their impact on efficiency.
◼
The core of the model revolves around calculating Ethernet efficiency using two key intermediate values: aVal (representing ‘A’, the probability of successful slot acquisition) and wVal (representing ‘W’, the average waiting slots). The eff function then computes the overall efficiency based on p (packet size), q (number of stations), and fixed constants c (channel capacity of 3 Mbps) and t (slot time of 16 µs), which are set to reflect the original Ethernet specifications.
◼
The Manipulate interface provides interactive sliders at the top for adjusting the Packet Size (bits) and Number of Stations (Q). As these parameters are changed, the “Current Efficiency” is dynamically updated and displayed at the bottom of the interface, along with the fixed channel parameters (C and T). The primary visual output consists of two ListLinePlot graphs displayed side-by-side: “Efficiency vs Packet Size” and “Efficiency vs Station Count”. Red points on these plots indicate the current efficiency for the selected parameter values, allowing for immediate visual feedback on the impact of adjustments.
This “Ethernet Performance Model” serves as a crucial “Code as Proof” artifact, designed to visually and quantitatively demonstrate the inherent limitations of traditional Ethernet’s statistical contention resolution. It reinforces the Daedaelus project’s foundational critique that conventional networks, by relying on such probabilistic mechanisms, inevitably lead to unpredictable “unbounded tail latency” and fail to provide “exactly-once semantics”. By clearly illustrating these fundamental problems through an interactive model, the tool underscores the critical necessity for the “Open Atomic Ethernet” standard, which aims to establish a truly reliable and deterministic communication fabric to address the persistent issues of data corruption and transaction failures in distributed systems.
This Mathematica code creates a comprehensive “Ethernet Performance Model” based on the 1976 Metcalfe & Boggs paper, designed to visualize and explore the theoretical efficiency of a shared Ethernet medium under various operating conditions. It offers a multi-faceted interactive environment to understand the interplay of key network parameters.
The core of the model is the efficiency function, which calculates theoretical Ethernet efficiency. This function relies on A[q_] (the probability of successful slot acquisition given q stations) and W[q_] (the average waiting slots due to contention). Efficiency is then computed as the ratio of time spent transmitting a packet to the total time, incorporating p (packet size), C (channel capacity), and T (slot time). The Manipulate interface provides sliders to dynamically adjust Capacity (bps) and Slot Time (µs), allowing users to explore how these fundamental characteristics of the “1976 Experimental System” affect overall performance.
The tool generates three distinct visualizations for “Performance Analysis”:
The tool generates three distinct visualizations for “Performance Analysis”:
◼
Ethernet Efficiency (1976 Model) (3D Plot): A Plot3D displays efficiency as a surface across varying Packet Size (bits) and Stations (Q). This provides a holistic view of how these two critical factors collectively influence network performance.
◼
Efficiency vs Packet Size (2D Plot): A Plot shows multiple curves, each representing Efficiency versus Packet Size for different fixed numbers of Stations (Q) (e.g., Q=1, 2, 5, 10, 20, 50). This illustrates how efficiency generally improves with larger packets but also how increased station count limits this improvement.
◼
Efficiency Contours (Contour Plot): A ContourPlot displays efficiency contour lines on a 2D plane, mapping different combinations of packet size and stations to specific efficiency levels. This helps identify regions of high and low performance across the parameter space.
This “Ethernet Performance Model” serves as a crucial “Code as Proof” artifact, designed to visually and quantitatively demonstrate the inherent limitations of traditional Ethernet’s statistical contention resolution. It reinforces the Daedaelus project’s foundational critique that conventional networks, by relying on such probabilistic mechanisms, inevitably lead to unpredictable “unbounded tail latency” and fail to provide “exactly-once semantics”. By clearly illustrating these fundamental problems across a range of operating conditions, the model underscores the critical necessity for the “Open Atomic Ethernet” standard, which aims to establish a truly reliable and deterministic communication fabric to address the persistent issues of data corruption and transaction failures in distributed systems.
This “Ethernet Performance Model” serves as a crucial “Code as Proof” artifact, designed to visually and quantitatively demonstrate the inherent limitations of traditional Ethernet’s statistical contention resolution. It reinforces the Daedaelus project’s foundational critique that conventional networks, by relying on such probabilistic mechanisms, inevitably lead to unpredictable “unbounded tail latency” and fail to provide “exactly-once semantics”. By clearly illustrating these fundamental problems across a range of operating conditions, the model underscores the critical necessity for the “Open Atomic Ethernet” standard, which aims to establish a truly reliable and deterministic communication fabric to address the persistent issues of data corruption and transaction failures in distributed systems.
This Mathematica code creates an interactive “ETHERNET PERFORMANCE VISUALIZER (METCALFE-BOGGS MODEL)”, designed to illustrate the theoretical efficiency of a shared-medium Ethernet network. The tool provides a dynamic platform for exploring how fundamental network parameters influence performance, based on the foundational work of Metcalfe and Boggs.
The visualizer’s core functionality is derived from the Efficiency function, which calculates the theoretical efficiency of Ethernet. This calculation accounts for packet size (p), channel capacity (c), slot time (t), and the number of stations (q). It incorporates intermediate values like aVal (the probability of successful slot acquisition) and wVal (the average waiting slots due to contention), all crucial components of the Metcalfe-Boggs model. The Manipulate interface provides sliders for SIMULATION PARAMETERS such as Packet Size and Number of Stations, allowing users to adjust these values in real-time. Additionally, NETWORK CONFIGURATION sliders for Capacity (Mbps) and Slot Time (µs) enable exploration of how changes in the underlying physical layer characteristics impact network efficiency. The interface displays two primary plots: “Efficiency vs. Number of Stations” (for a fixed packet size) and “Efficiency vs. Packet Size” (for a fixed number of stations), both of which dynamically update as parameters are adjusted. A “Reset to Paper Defaults” button allows users to revert to the original parameters from the Metcalfe & Boggs paper. This tool serves as a “Code as Proof” artifact, visually demonstrating the inherent limitations of traditional Ethernet’s statistical contention resolution. It reinforces the Daedaelus project’s foundational critique that conventional networks, by relying on such probabilistic mechanisms, inevitably lead to unpredictable “unbounded tail latency” and fail to provide “exactly-once semantics”.
This Mathematica code provides a visual simulation of an Ethernet CSMA/CD network, illustrating the dynamic behavior of stations contending for a shared bus. Unlike previous slot-based simulations, this model uses an event-driven approach with a PriorityQueue to manage discrete events in continuous time, offering a more realistic representation of network dynamics. The simulation meticulously tracks individual station states (idle, ready, backoff, transmitting, collision), packet arrivals, and the overall bus state, capturing the complex interplay of contention for channel access. The visual output dynamically updates, showing stations’ positions and statuses on the bus, allowing for a clear, real-time observation of packet propagation, collisions, and backoff mechanisms.
This event-driven simulation serves as a powerful “Code as Proof” artifact, designed to highlight the inherent limitations of traditional Ethernet’s statistical contention resolution. It vividly illustrates how factors like random packet arrivals and propagation delays lead to collisions, forcing stations into unpredictable backoff periods, consuming valuable channel time, and ultimately contributing to “unbounded tail latency”. This directly supports the Daedaelus project’s core critique that conventional networks cannot guarantee “exactly-once semantics” and suffer from “irreversible smash and restart of Shannon information” for failure recovery. The simulator therefore underscores the critical necessity for the “Open Atomic Ethernet” standard, which aims to provide predictable and reliable distributed communication by moving beyond these inherent probabilistic constraints and implementing mechanisms like “Truncated Tail Latency”.
This Mathematica code provides a dual visualization of Ethernet network performance, simulating its efficiency under heavy load and providing a timeline of channel activity based on the Metcalfe & Boggs model. It offers a “Code as Proof” demonstration of the theoretical limits and practical challenges of traditional Ethernet’s contention-based access.
The simulation uses core parameters like slotTime, channelCapacity, and packetSize to define the network’s physical characteristics. The theoreticalEfficiency function calculates efficiency based on the Metcalfe-Boggs model, while SimulateEthernet performs a Monte Carlo simulation of contention, tracking totalContention and totalTransmission slots over many cycles to derive simulated efficiency. The efficiencyPlot visually compares the simEff (simulated efficiency) and theoryEff (theoretical efficiency) as the number of Number of Stations (Q) increases, using distinct line styles and legends to highlight the comparison. This plot demonstrates how efficiency degrades under heavy load and how the simulation tracks the theoretical model. Complementing this, the SimulateTimeline function generates a detailed timeline of “Ethernet Channel Activity” over a specified number of maxSlots for a given Q. This timeline visually represents each slot’s state—IDLE, SUCCESS, COLLISION, or TRANSMITTING—using distinct colors and a legend. The timelinePlot provides a clear, granular view of how contention and collisions lead to wasted channel time, directly illustrating the mechanisms that reduce overall efficiency. This comprehensive analysis reinforces the Daedaelus project’s core critique that conventional networks, by relying on probabilistic contention, inevitably lead to unpredictable “unbounded tail latency” and fail to provide “exactly-once semantics”.
This Mathematica code constructs and visualizes a “Spekkens Toy Model: State Transition Graph,” which serves as a powerful demonstration of state dynamics and transformations within a simplified quantum information theory framework. The model explores how different initial “SpekkensStates” evolve under a defined set of “SpekkensPermutations,” representing operations that transform these states.
The core of the model involves SpekkensStates, defined as a set of 4-element lists (or vectors), and SpekkensPermutations, which are specific permutations applied to these states. The baseStates are generated by taking Kronecker products of pairs from SpekkensStates, creating a richer set of composite states, visualized as 4x4 grids. The applyPerm function then applies a given permutation matrix to these baseStates, simulating a state transition. Edges in the graph are established between baseStates and their newState counterparts after applying the permutations, with DeleteDuplicates ensuring unique, undirected connections.
The DynamicModule creates an interactive visualization of this state transition graph. Each node in the graph represents one of the baseStates, rendered as an ArrayPlot (a 4x4 grid). Users can “Click any state to select” it, which causes the selected node to turn green, and its directly “connected states” (neighbors in the graph) to turn gray, clearly highlighting the immediate possible transitions. This interactive feature, along with the “SpringElectricalEmbedding” layout, makes the abstract state transitions intuitive and explorable, effectively serving as a “Code as Proof” artifact for understanding foundational concepts in quantum information and multiway systems.
The DynamicModule creates an interactive visualization of this state transition graph. Each node in the graph represents one of the baseStates, rendered as an ArrayPlot (a 4x4 grid). Users can “Click any state to select” it, which causes the selected node to turn green, and its directly “connected states” (neighbors in the graph) to turn gray, clearly highlighting the immediate possible transitions. This interactive feature, along with the “SpringElectricalEmbedding” layout, makes the abstract state transitions intuitive and explorable, effectively serving as a “Code as Proof” artifact for understanding foundational concepts in quantum information and multiway systems.
◼
This “Spekkens Toy Model” directly underpins the Daedaelus mission, which is “inspired by Quantum Information Theory and Multiway Systems”. The state transitions and permutations within this toy model provide a simplified analogy for the complex “Token Dynamics” and “Reversible Subtransactions” that form the bedrock of the Daedaelus architecture. By exploring how states transform and are conserved (or not) under specific rules, this model informs the design of protocols that achieve “exactly-once semantics” and “truncated tail latency” in distributed systems, without relying on the “irreversible smash and restart of Shannon information”. It offers insight into how “rulesets” can enable “non-zero-sum game (NZSG) outcomes,” promoting cooperative behavior and ensuring winners are those who exhibit trustable actions within the network.
◼
This Mathematica code implements an interactive “Spekkens Toy Model” that allows users to explore state transitions under permutations, providing a simplified yet insightful demonstration of concepts relevant to quantum information theory. The model defines a set of fundamental SpekkensStates (represented as binary 4-element lists, like {{1, 1, 0, 0}}) and SpekkensPermutations (specific cyclic permutations, like Cycles[{{1, 2}, {3, 4}}]) that act upon these states.
The interactive interface, powered by DynamicModule and Manipulate, features a “Current State” display, visualized as a StateGrid (a 2x2 binary array), which can be randomized using a “Random State” button. Users can Select Permutation from a dropdown menu, choosing from either the SpekkensPermutations or a Show Full Permutation Set option. The effect of the selectedPerm on the currentState is previewed in a separate StateGrid. A crucial “Apply” button then transitions the Current State by applying the chosen permutation, allowing for step-by-step exploration of state evolution. The tool further enables the generation of a “State Space” graph up to a specified Graph Depth, visually mapping all reachable states and their connections under the chosen permutations, providing a “Code as Proof” artifact for understanding state dynamics.
This “Spekkens Toy Model” directly informs the Daedaelus mission, which is fundamentally “inspired by Quantum Information Theory and Multiway Systems”. The exploration of state transitions and permutations within this model serves as an analog for the “Token Dynamics” that underpin the Daedaelus architecture, particularly the concept of “conserved quantities/exchanged quantities/reversal recovery/lost baggage on TRAPHs”. By understanding how states can be reversibly transformed or how specific “rulesets” lead to predictable outcomes, this model provides insights into designing protocols that achieve “exactly-once semantics” and “truncated tail latency” in distributed systems, without relying on the “irreversible smash and restart of Shannon information to recover from failures”. The rigorous analysis of such state-space dynamics is essential for building “precise information-theoretic emulators” for “Digital Twins” and enabling “non-zero-sum game (NZSG) outcomes” where cooperative behavior is rewarded.
This “Spekkens Toy Model” directly informs the Daedaelus mission, which is fundamentally “inspired by Quantum Information Theory and Multiway Systems”. The exploration of state transitions and permutations within this model serves as an analog for the “Token Dynamics” that underpin the Daedaelus architecture, particularly the concept of “conserved quantities/exchanged quantities/reversal recovery/lost baggage on TRAPHs”. By understanding how states can be reversibly transformed or how specific “rulesets” lead to predictable outcomes, this model provides insights into designing protocols that achieve “exactly-once semantics” and “truncated tail latency” in distributed systems, without relying on the “irreversible smash and restart of Shannon information to recover from failures”. The rigorous analysis of such state-space dynamics is essential for building “precise information-theoretic emulators” for “Digital Twins” and enabling “non-zero-sum game (NZSG) outcomes” where cooperative behavior is rewarded.
This Mathematica code visualizes “Spekkens Toy Model State Transitions,” demonstrating the relationships and transformations between a set of fundamental states under defined permutation operations. The model begins with states (representing simplified quantum states as 4-element binary lists) and perms (a set of cyclic permutations that act on these states). The code then constructs a graph where each node corresponds to a state, and edges connect states that can be transformed into one another by applying a perm. The DynamicModule renders this graph, visualizing each state as a 2x2 ArrayPlot (a small grid of blue and white squares) and allowing users to click on a node to highlight its connected component, showcasing the interconnectedness of the state space. This interactive visualization serves as a “Code as Proof” artifact, providing a concrete example of state transitions within a multiway system, which directly informs the “Token Dynamics” and “Time-reversible constructors” central to the Daedaelus philosophy for ensuring “exactly-once semantics” and recovering from failures without the “irreversible smash and restart of Shannon information”.
This Mathematica code creates a “Spekkens Toy Model Explorer,” an interactive tool designed to visualize and manipulate states and their transitions within a framework inspired by quantum information theory and multiway systems. The model defines a set of SpekkensStates (basic 4-element binary vectors) and SpekkensPermutations (cyclic permutations that act as operators). These SpekkensStates are combined using Kronecker products to form bipartiteStates, which serve as the nodes in the state space graph, each represented as a 4x4 grid.
The interactive interface features prominent displays for the “Current State” and “Transformed State,” both visualized as 4x4 binary grids. Users can select a currentState by clicking on any of the smaller 4x4 state grids displayed in a grid format, allowing for direct manipulation and exploration of specific states. A series of “Apply Permutation” buttons, each corresponding to one of the SpekkensPermutations, allows the user to apply a chosen permutation to the Current State, instantly updating the “Transformed State” and visually demonstrating the effect of the operation.
A “State Space Graph” dynamically visualizes the entire network of possible transitions, where nodes are the bipartiteStates and edges represent the relationships defined by applying permutations. The Current State is highlighted in blue, and the Transformed State in red, making the cause-and-effect of permutation applications clear within the broader state space. This “Spekkens Toy Model Explorer” serves as a powerful “Code as Proof” artifact for understanding the foundational concepts of state dynamics and reversible transformations. It directly informs the Daedaelus mission, which is “inspired by Quantum Information Theory and Multiway Systems”. The model provides an accessible analogy for “Token Dynamics” and “Reversible Subtransactions” crucial to building distributed systems that ensure “exactly-once semantics” and recover from failures without the “irreversible smash and restart of Shannon information”.
A “State Space Graph” dynamically visualizes the entire network of possible transitions, where nodes are the bipartiteStates and edges represent the relationships defined by applying permutations. The Current State is highlighted in blue, and the Transformed State in red, making the cause-and-effect of permutation applications clear within the broader state space. This “Spekkens Toy Model Explorer” serves as a powerful “Code as Proof” artifact for understanding the foundational concepts of state dynamics and reversible transformations. It directly informs the Daedaelus mission, which is “inspired by Quantum Information Theory and Multiway Systems”. The model provides an accessible analogy for “Token Dynamics” and “Reversible Subtransactions” crucial to building distributed systems that ensure “exactly-once semantics” and recover from failures without the “irreversible smash and restart of Shannon information”.