Basic function
Basic function
Let’s make a function that renders a space-curve sc, for time t, while a fraction of ϕ is visible, and for the PlotRange pr.
$HistoryLength=2;ClearAll[MakeScene]MakeScene[sc_,t_,ϕ_,pr_]:=Module[{pts,tt,r,nn,gr},r=0.5;(*radiusoftube*)nn=150;(*numberofpoints*)pts=Table[sc[-2Pitt],{tt,Subdivide[t,t+ϕ,nn]}];gr=Graphics3D[{Directive[{MaterialShading["Iron"]}],CapForm["Square"],Tube[BSplineCurve[pts,SplineDegree2],r]},Lighting{SpotLight[White,{14{Sin[2Pit],-Cos[2Pit],1.4+1Cos[3×2Pit]},{0,0,0}},Pi/2],AmbientLight[GrayLevel[0.2]]},(*movethelightsaroundinxyz*)BackgroundBlack,ViewVector{{0,0,30},{0,0,0}},ViewVertical{Sin[2Pit],Cos[2Pit],0},(*rotatetheview*)ViewVertical{0,1,0},PlotRangepr,Method->{"TubePoints"->30,"SpherePoints"->3},BoxedFalse,ImageSize800{1,1}];ImageResize[Rasterize[gr,RasterSize800{1,1}],Scaled[0.5]]]
Trefoil chaser
Trefoil chaser
Get the space curve, modify it a bit, find the plot range, and do a test-scene:
In[]:=
sc=KnotData["Trefoil","SpaceCurve"];sc[[1,;;2,2]]*=1.5;(*makeitabitless'tight'*)sc[[1,3]]*=3;(*andmore'tall'*)pr=CoordinateBounds[Table[sc[t],{t,0,2Pi,Pi/100.0}],0.6];(*gettheplotrangeandfixit*)MakeScene[sc,0,0.9,pr]
Out[]=
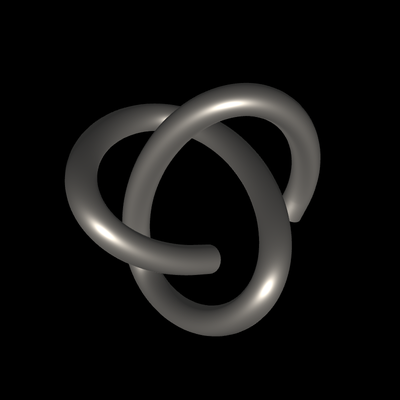
Let’s vary the fraction ϕ over time, so it is chasing, getting closer and further away and so on:
In[]:=
Plot[0.875+0.075Cos[2Pi(#-0.05Cos[2Pi#])]&[t],{t,0,1},PlotRange{0.7,1}]
Out[]=
make the images:
In[]:=
imgs=Parallelize[MakeScene[sc,#,0.875+0.075Cos[2Pi(#-0.05Cos[2Pi#])],pr]&/@Most[Subdivide[0,1,60]]];
Let’s export the images:
In[]:=
SetDirectory[NotebookDirectory[]];Export["chasingtrefoil.gif",imgs,"DisplayDurations"->1/30]
Out[]=
chasingtrefoil.gif