What Countries Are Hit Hard by COVID-19 Outbreak?

Mads Bahrami
Wolfram Research, Inc.
True impact of a COVID-19 outbreak highly depends on the readiness of countries to deal with waves of patients. In this short computational essay, I compare ten counties with the largest COVID-19–positive cases by considering the total number of beds available in hospitals. The result gives a different picture than a simple counting of positive cases, implying very high pressure on public health systems of corresponding countries.

Hospital bed data per country

Get the data of hospital beds per 1000 inhabitants from the Wolfram Data Repository:
dsBeds=ResourceDataResourceObject
;
In[]:=
Since Iran's data is missing, I extracted Iran's total hospital bed data from World Bank data and put it on the Wolfram cloud.
Append Iran's data to the hospital dataset and finally sort it by country:
dsBeds=DatasetAppendNormal[dsBeds],AssociationThreadNormal[Keys[dsBeds[1]]]
Iran
COUNTRY
,Missing["NotAvailable"],Missing["NotAvailable"],CloudGetCloudObject
[SortBy["Country"]];
In[]:=
Generate a bar chart for a list of total hospital beds per 1000 inhabitants per country:
BarChartdt=Sort@Normal@dsBeds[GroupBy["Country"],Total,#TotalBedsPer1000Inhabitants["LastValue"]&],ChartLabelsCommonName@Keys@dt,

In[]:=
Out[]=
Extract the last value of total beds per 1000 inhabitants and calculate the total number of beds:
totalBeds=Normal@dsBedsGroupBy["Country"],Total,Switch#TotalBedsPer1000Inhabitants,_Missing,Missing["NotAvailable"],_TemporalData,
QuantityMagnitude[#Country["Population"]]
1000
#TotalBedsPer1000Inhabitants["LastValue"]&;
In[]:=

COVID-19 Data

Get COVID-19 epidemic data from the Wolfram Data Repository:
dsCOVID19=ResourceData["Epidemic Data for Novel Coronavirus COVID-19"];
In[]:=
Assuming that all beds are maintained, staffed and immediately available for COVID-19 patients, a measure for the readiness can be introduced as follows:
Number of Confirmed Cases
Total Number of Beds
Out[]//TraditionalForm=
It is definitely an overestimation and a very crude measure. For example, not all beds can be ready for COVID-19 patients; however, this idealistic measure can provide some good insight. The smaller is the measure, the better; the larger this measure, the more alarming the situation would be, implying that the resources are depleting. Let us add a new column to our dataset for this measure.
Add a new column, which is %ConfirmedCases/TotalBeds:
dsCOVID19Beds=Dataset@Association@KeyValueMap[<|#1<|{#2,"PercentAvailableBeds"100.#2["ConfirmedCases"]/totalBeds[#1]}|>|>&][Normal@dsCOVID19[GroupBy["Country"],Total,{"ConfirmedCases","RecoveredCases","Deaths"}]];
In[]:=

Comparing Results

As of March 22, the top ten countries with the largest confirmed cases of COVID-19, sorted in descending order, are China, Italy, the United States, Spain, Germany, Iran, France, South Korea, Switzerland and the United Kingdom.
Plot data for the top ten countries with the largest number of confirmed cases:
DateListLogPlot[dsCOVID19Beds[TakeLargestBy[#ConfirmedCases["LastValue"]&,10]][All,"ConfirmedCases"],GridLinesAutomatic,PlotMarkersAutomatic,ImageSize400,PlotLabel"ConfirmedCases vs time (Log scaling)",PlotRange{{{2020,2,15},Automatic},{1,Automatic}}]
In[]:=
Out[]=
However, when including the total hospital beds per country, one observes a different order.
For the top ten countries with the largest number of confirmed cases, plot the %ConfirmedCases/TotalBeds:
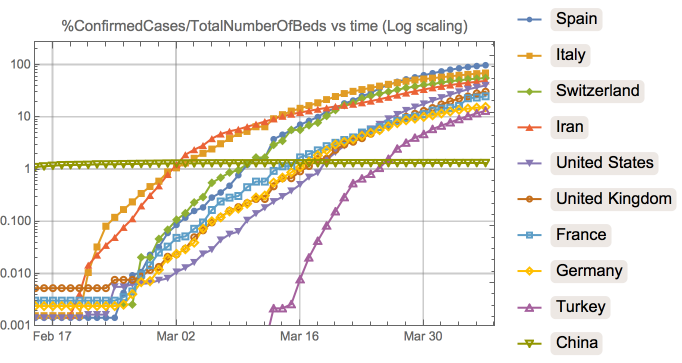
DateListLogPlot[dsCOVID19Beds[TakeLargestBy[#ConfirmedCases["LastValue"]&,10]][ReverseSortBy[#PercentAvailableBeds["LastValue"]&]][All,"PercentAvailableBeds"],GridLinesAutomatic,PlotMarkersAutomatic,ImageSize400,PlotLabel"%ConfirmedCases/TotalNumberOfBeds vs time (Log scaling)",PlotRange{{{2020,2,15},Automatic},{0.001,Automatic}}]
In[]:=
Out[]=

Concluding Remarks

How bad a country is hit by a COVID-19 outbreak depends on the number of confirmed cases together with available resources (mostly medical ones). Taking into the account the total number of available hospital beds per country, my analysis suggests that the situation in Italy, Spain, Switzerland and Iran is about ten times or more worse than other countries, implying very high pressure on their public health systems.

Disclaimer

This analysis works with the pre-existing number of beds. We know that China created a few thousands more beds within days, and the same with Germany, which will soften the impact.

Acknowledgment

I would like to thank the Wolfram|Alpha team for their valuable help and input.