Geometrical Analysis of Genome for COVID-19 vs. SARS-Like Viruses

Mads Bahrami
Wolfram Research, Inc.
Z-curve theory provides a very unique geometrical approach for analyzing a genetic sequence, while preserving all the genome information. In this computational essay, I have developed a very efficient and fast function (in the Wolfram Language) to generate the Z-curve of any genetic sequence, regardless of its length. Then I generate Z-curves of 39 COVID-19 viruses together with 40 SARS-like viruses, using their complete genomes. Numerical analysis of corresponding Z-curves and their clustering shows a very close phylogenetic relationship between the family of COVID-19 viruses and the bat coronavirus isolate RaTG13 (MN996532), therefore supporting the hypothesis of a bat origin for COVID-19.

Collecting Data

Here is the accession list of SARS-like viruses:
viruses="AY274119.3","AY278488.2",
,"NC_004718","NC_009019";
One can use the function ImportFASTA, from the Wolfram Function Repository, to import FASTA data from the NCBI using an NCBI Reference Sequence. To save time, I have done this and given it an iconized form.
In[]:=
virusNameSeq=
VirusNameSequence
(*Map[ResourceFunction["ImportFASTA"],viruses]*);
Take the first element from all sublists of virusNameSeq, flatten the result and return the substrings from the first space to ",":
In[]:=
names=Flatten[StringCases[virusNameSeq[[All,1]]//Flatten," "~~x__~~","x]];​​Short[names,3]
Out[]//Short=
{Severe acute respiratory syndrome-related coronavirus isolate Tor2,SARS coronavirus BJ01,SARS coronavirus HKU-39849,SARS coronavirus CUHK-W1,SARS coronavirus Urbani,47,Rousettus bat coronavirus isolate GCCDC1 356,Bat coronavirus HKU9-1,Wuhan seafood market pneumonia virus isolate Wuhan-Hu-1,SARS coronavirus,Bat coronavirus HKU4-1}
Here is a replacement rule to change U to T and keep only A, C, G and T:
In[]:=
srules={"U""T",Except[Characters["ACGT"]]""};
Give an association with the viruses’ accessions as keys and sequences as values, then replace the sequences using srules:
In[]:=
dataSARSCoV=StringReplace[srules]/@AssociationThread[viruses,Flatten[virusNameSeq[[All,2]]]];
Take COVID-19 data from the Wolfram Data Repository, then select those whose whole GenBank title contains "complete genome":
In[]:=
dataWDR=ResourceData["Genetic Sequences for Novel Coronavirus 2019-nCoV from Wuhan, China"][Select[StringContainsQ[#GenBankTitle,"complete genome"]&]];
From the previous imported data, take only the Accession and Sequence columns, make them an association with accessions as keys and sequences as values, then replace the sequences using srules:
In[]:=
dataCOVID19=StringReplace[srules]/@<|Rule@@@Normal[Values[dataWDR[All,{"Accession","Sequence"}]]]|>;
Generate an association from SARS-like and COVID-19 viruses with accessions as keys and corresponding names as values:
In[]:=
accessionNameAssoc=Join[AssociationThread[viruses(Style[#,Bold,Italic]&/@names)],AssociationThread[Keys[dataCOVID19]StringSplit[StringSplit[Normal[dataWDR[All,"GenBankTitle"]],","][[All,1]],"isolate"|" 2 "|"strain"][[All,-1]]]];

Z-Curve

For a given genetic sequence of length N, let’s denote the number of occurrences of A, C, G and T bases at the
th
n
subsequence with
A
n
,
C
n
,
G
n
and
T
n
. Then the corresponding 3D coordinate for the
th
n
subsequence is obtained by the following transformation:
Out[]//TraditionalForm=
x
n
y
n
z
n

1
-1
1
-1
1
1
-1
-1
1
-1
-1
1
A
n
C
n
G
n
T
n
For example, for a sequence such as AACGT, we have
{
A
1
=1,
C
1
=0,
G
1
=0,
T
1
=0}
,
{
A
2
=2,
C
2
=0,
G
2
=0,
T
2
=0}
,
{
A
3
=2,
C
3
=1,
G
3
=0,
T
3
=0}
,
{
A
4
=2,
C
4
=1,
G
4
=1,
T
1
=0}
and
{
A
5
=2,
C
5
=1,
G
5
=1,
T
5
=1}
. The corresponding Z-curve would be
{{0,0,0},{1,1,1},{2,2,2},{1,3,1},{2,2,0},{1,1,1}}
.
Note
x
n
=(
A
n
+
G
n
)-(
C
n
+
T
n
)
is the difference between the purine bases (R) and the pyrimidine bases (Y). Therefore, it is a measure of RY disparity. Likewise,
y
n
quantifies the amino (M) and keto (K) difference, called MK disparity, with
z
n
the WS disparity (W for weak and S for strong hydrogen bonds, respectively). More about RY, MK and WS disparities can be found here.
Generate a Z-curve by cumulative sums of four matrices assigned to A, C, G and T:
In[]:=
ZcurveGenerator[st_]:={{1,-1,1,-1},{1,1,-1,-1},{1,-1,-1,1}}.#&/@FoldList[#1+Switch[#2,"A",{1,0,0,0},"C",{0,1,0,0},"G",{0,0,1,0},"T",{0,0,0,1}]&,{0,0,0,0},Characters[st]]
Generate the Z-curves of the COVID-19 viruses (the result is an association in the form of accession→Z-curve):
In[]:=
zCurveCOVID19=ZcurveGenerator/@dataCOVID19;
Generate the Z-curves of the SARS-like viruses (the result is an association in the form of accession→Z-curve):
In[]:=
zCurveSARS=ZcurveGenerator/@dataSARSCoV;
Represent a 3D image of the Z-curve in which red belongs to SARS-like viruses and blue to COVID-19 viruses:
In[]:=
Legended[Graphics3D[{Blue,Values[Line/@zCurveCOVID19],Red,Values[Line/@zCurveSARS]},AxesTrue,ImageSizeLarge,BoxRatios{2,4,4},AxesLabel{"RY disparity","MK disparity","WS disparity"}],LineLegend[{Blue,Red},{"Z-curves of "<>ToString@Length@zCurveCOVID19<>" COVID19 viruses","Z-curves of "<>ToString@Length@zCurveSARS<>" SARS-like viruses"}]]
Out[]=
Find the shortest sequence and denote its length with min:
In[]:=
min=Min[Min[Length/@zCurveCOVID19],Min[Length/@zCurveSARS]]
Out[]=
21480
Trim the Z-curves up to the length of the shortest sequence:
In[]:=
trimmedZCurveCOVID19=Take[#,min]&/@zCurveCOVID19;​​trimmedzCurveSARS=Take[#,min]&/@zCurveSARS;
In[]:=
totalZcurves=Join[trimmedZCurveCOVID19,trimmedzCurveSARS];

Clustering and Classification Based on Z-Curves

Create a numeric array of the type double-precision real of each Z-curve:
In[]:=
nCOVID=NumericArray[#,"Real64"]&/@trimmedZCurveCOVID19;​​nSARS=NumericArray[#,"Real64"]&/@trimmedzCurveSARS;
Now let us find the three nearest Z-curves of SARS-like viruses to the Z-curve of each COVID-19 virus. Without loss of fidelity and to compute faster, we will first project the Z-curves into 30-D.
Reduce the dimension to 30-D:
In[]:=
allReduced=DimensionReduce[Join[Values[nCOVID],Values[nSARS]],30,Method"LatentSemanticAnalysis"];​​nCOVIDreduced=Take[allReduced,Length[Values[nCOVID]]];​​nSARSreduced=AssociationThread[Keys[nSARS]Drop[allReduced,Length[Values[nCOVID]]]];
Find the three nearest Z-curves of SARS-like viruses to the Z-curve of each COVID-19 virus:
In[]:=
closest=Nearest[nSARSreduced,nCOVIDreduced,3]//Flatten//Tally
Out[]=
{{NC_045512,324},{MN996532,324},{MG772934.1,324}}
Flatten out the closest and obtain tallies:
In[]:=
closest//Flatten//Tally
Out[]=
{{NC_045512,1},{324,3},{MN996532,1},{MG772934.1,1}}
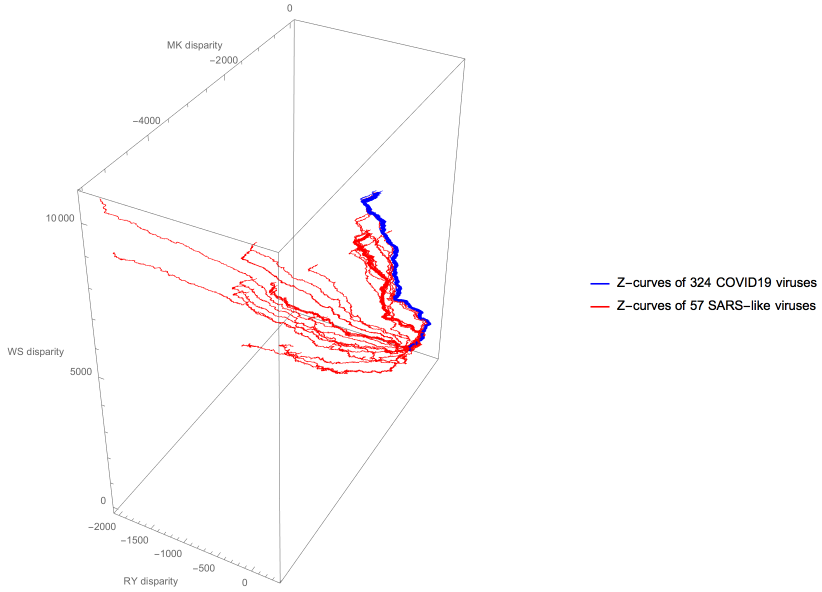
As suggested by the Z-curve visualization, the three nearest SARS-like viruses are the same for all COVID-19 viruses.
Delete duplicates from the previous result and return their GenBank titles:
In[]:=
Map[accessionNameAssoc[#]&,DeleteDuplicates[closest],{2}]//Flatten
Out[]=
{ Wuhan-Hu-1,Missing[KeyAbsent,324],Bat coronavirus RaTG13,Missing[KeyAbsent,324],Bat SARS-like coronavirus isolate bat-SL-CoVZXC21,Missing[KeyAbsent,324]}
Our analysis shows that among the 57 SARS-like viruses that we study here, bat coronavirus isolate RaTG13, bat SARS-like coronavirus isolate bat-SL-CoVZXC21 and bat SARS-like coronavirus isolate bat-SL-CoVZC45 have the closest genome similarity to the COVID-19 viruses, providing evidence for a bat origin of COVID-19.
Let us do some hierarchical clustering.
In[]:=
numericArray=Join[nSARS,nCOVID];
Cluster the viruses based on their Z-curves using a single-linkage clustering algorithm:
In[]:=
clusters=FindClusters[numericArray];
Assign a different color to each cluster, and represent 3D images of corresponding Z-curves:
In[]:=
Legended[Graphics3D[Riffle[colors=Take[ColorData[ColorData["Indexed"][[-5]],"ColorList"],UpTo[Length@clusters]],(Line/@Lookup[#][totalZcurves])&/@clusters],AxesTrue,ImageSizeLarge,BoxRatios{2,4,4},AxesLabel{"RY disparity","MK disparity","WS disparity"}],LineLegend[colors,Table["Cluster#"<>ToString[i]<>" ("<>ToString[Length[clusters[[i]]]]<>" viruses)",{i,Length[clusters]}]]]
Project clusters into 3D using the t-distributed stochastic neighbor embedding algorithm:
Construct a dendrogram from the hierarchical clustering of the Z-curves (note the coloring is the same as the one for clusters; those that are bold and italic are SARS-like viruses):

Concluding Remarks

I generated the Z-curves of 39 available genetic sequences of COVID-19 viruses together with 40 SARS-like viruses. An eyeballing of the 3D visualization of the Z-curves suggests that there are three SARS-like viruses very close to the virus family of COVID-19. By qualifying the similarity/dissimilarity between Z-curves, I identify those three viruses as bat coronavirus isolate RaTG13 (MN996532), bat SARS-like coronavirus isolate bat-SL-CoVZXC21 (MG772934 .1) and bat SARS-like coronavirus isolate bat-SL-CoVZC45 (MG772933 .1). The hierarchical clustering of viruses based on the Z-curves also confirms the visualization, and identifies bat coronavirus isolate RaTG13 as the most likely culprit of COVID-19. My results strongly support the hypothesis of a bat origin for COVID-19.

Acknowledgments

I would like to thank Dr. Robert Nachbar and Dr. Daniel Lichtblau for their valuable feedback.

References

Zhang, Ren and Chun-Ting Zhang. 2014. “A Brief Review: The Z-Curve Theory and Its Application in Genome Analysis.” Current Genomics 15(2) (April): 78–94. https://doi.org/10.2174/1389202915999140328162433.
Zheng, W. X., L. L. Chen, H. Y. Ou, F. Gau and C. T. Zhang. 2005. “Coronavirus Phylogeny Based on a Geometric Approach.” Molecular Phylogenetics and Evolution 36(2) (August): 224–32. https://doi.org/10.1016/j.ympev.2005.03.030.