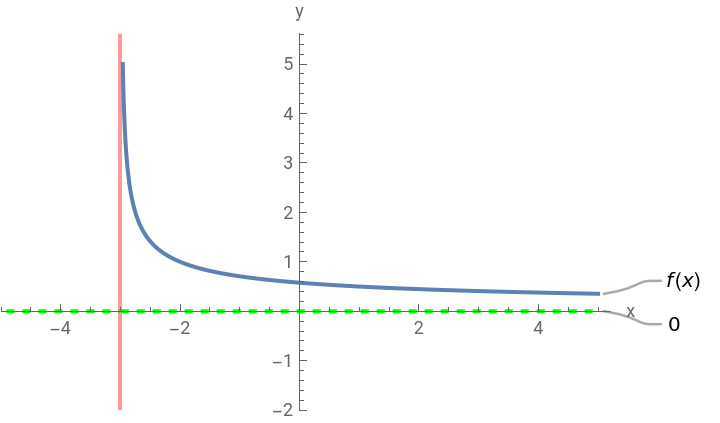
Sketch the graph of the function f(x)1x+3
Sketch the graph of the function
f(x)
1
x+3
◼
Consider 0. Impossible! So there is no -intercept.
1
x+3
x
◼
Now, . Thus the -intercept is at .
f(0)
1
3
y
y
1
3
◼
The domain of the function is (-3,+∞)
D
f
In[]:=
FunctionDomain[1/Sqrt[x+3],x]
Out[]=
x>-3
◼
The range of the function is
f(D)(0,+∞)
In[]:=
FunctionRange[1/Sqrt[x+3],x,y]
Out[]=
y>0
◼
There is vertical asymptote at and horizontal at
x-3
y0
In[]:=
ResourceFunction["Asymptotes"][1/Sqrt[x+3],x,y]
Out[]=
Horizontal{{y0,x±∞}},Vertical{{y∞,x-3}}
In[]:=
f[x_]:=1/Sqrt[x+3];
In[]:=
Plot[{f[x],0},{x,-10,5},PlotRange{{-5,5},{-2,5}},GridLines{{{-3,Directive[Thick,Red]}},None},PlotStyle{Thick,{Green,Thick,Dashed}},PlotLabelsAutomatic,AxesLabel{"x","y"}]
Out[]=