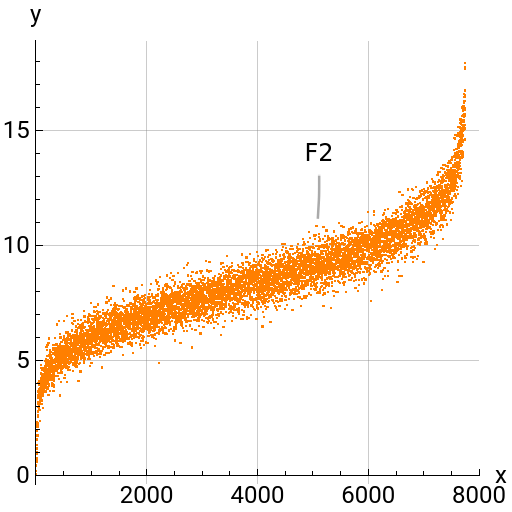
I’d like to measure the variance (noise) in F2. generated by a natural process.
One approach is to fit a continuous function f[x] to the data and then measure (F2 - f[x]).
The data looks a bit like inclined tan[x] or sinh[x], so I tried those and came up short.
What other models or approaches might I try?
One approach is to fit a continuous function f[x] to the data and then measure (F2 - f[x]).
The data looks a bit like inclined tan[x] or sinh[x], so I tried those and came up short.
What other models or approaches might I try?
In[]:=
F2=#[[1]]&/@Import["http://tangentvectors.org/data/F2.csv"];
In[]:=
F2Plot=ListPlot[F2,AxesOrigin{0,0},PlotRange{{0,8000},All},PlotStyle{Orange,PointSize[0.005]},PlotLabelsCallout[Style["F2",Black,12],{Scaled[0.66],Above}],AxesStyle{{Black,12},{Black,12}},AxesLabel{Style["x",Black,12],Style["y",Black,12]},GridLinesAutomatic,AspectRatio1,ImageSize{256,256}];Print[F2Plot];
In[]:=
{F2min,F2mean,F2max}={Min[F2],Mean[F2],Max[F2]};F2extent=F2max-F2min
Out[]=
17.8933
In[]:=
ds=15;B=Mean[F2[[(7500/2)-ds;;(7500/2)+ds]]]
Out[]=
8.03997
In[]:=
Plot[Tan[x],{x,Pi/2,Pi*3/2},AxesOrigin{0,0}]
Out[]=
In[]:=
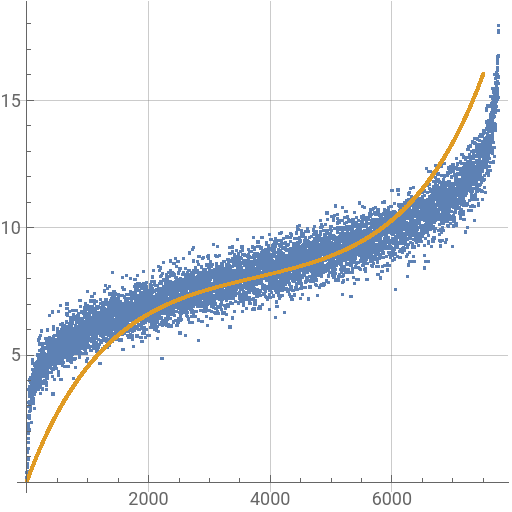
tanmax=7;tanExtent=2*tanmax;solution=Solve[(Tan[x]-tanmax)∧(x>Pi/2)∧(x<Pi),x];txMin=x/.solution[[1]];txMax=2*π-txMin;txExtent=txMax-txMin;Print[Tan[#]&/@{txMin,txMax}//N];b=tanmax+F2min;F2a={x,b+((x-1)*(B-b)/((7500/2)-1))+Tan[(txExtent/(7500-1))*(x-1)+txMin]}/.x#&/@Range[7500];FP=ListPlot[{F2,F2a},PlotRangeAll,GridLinesAutomatic,AspectRatio1,ImageSize{256,256}];Print[FP];
{-7.,7.}
In[]:=
Plot[Sinh[x],{x,-7,7},AxesOrigin{0,0}]
Out[]=
In[]:=
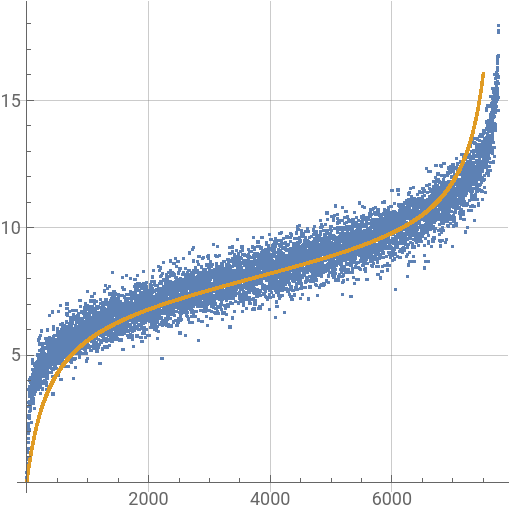
sxMin=-2.8;sxMax=-sxMin;sxExtent=sxMax-sxMin;Print[(sxExtent/(7500-1))*(#-1)+sxMin&/@{1,7500}];Print[Sinh[#]&/@{sxMin,sxMax}//N];shmax=Sinh[sxMax];shExtent=2*shmax;b=-(F2extent/shExtent)*Sinh[sxMin]+F2min;F2a={x,b+((x-1)*(B-b)/((7500/2)-1))+(F2extent/shExtent)*Sinh[(sxExtent/(7500-1))*(x-1)+sxMin]}/.x#&/@Range[7500];FP=ListPlot[{F2,F2a},PlotRangeAll,GridLinesAutomatic,AspectRatio1,ImageSize{256,256}];Print[FP];
{-2.8,2.8}
{-8.19192,8.19192}