Compressibility Factor Charts
Compressibility Factor Charts

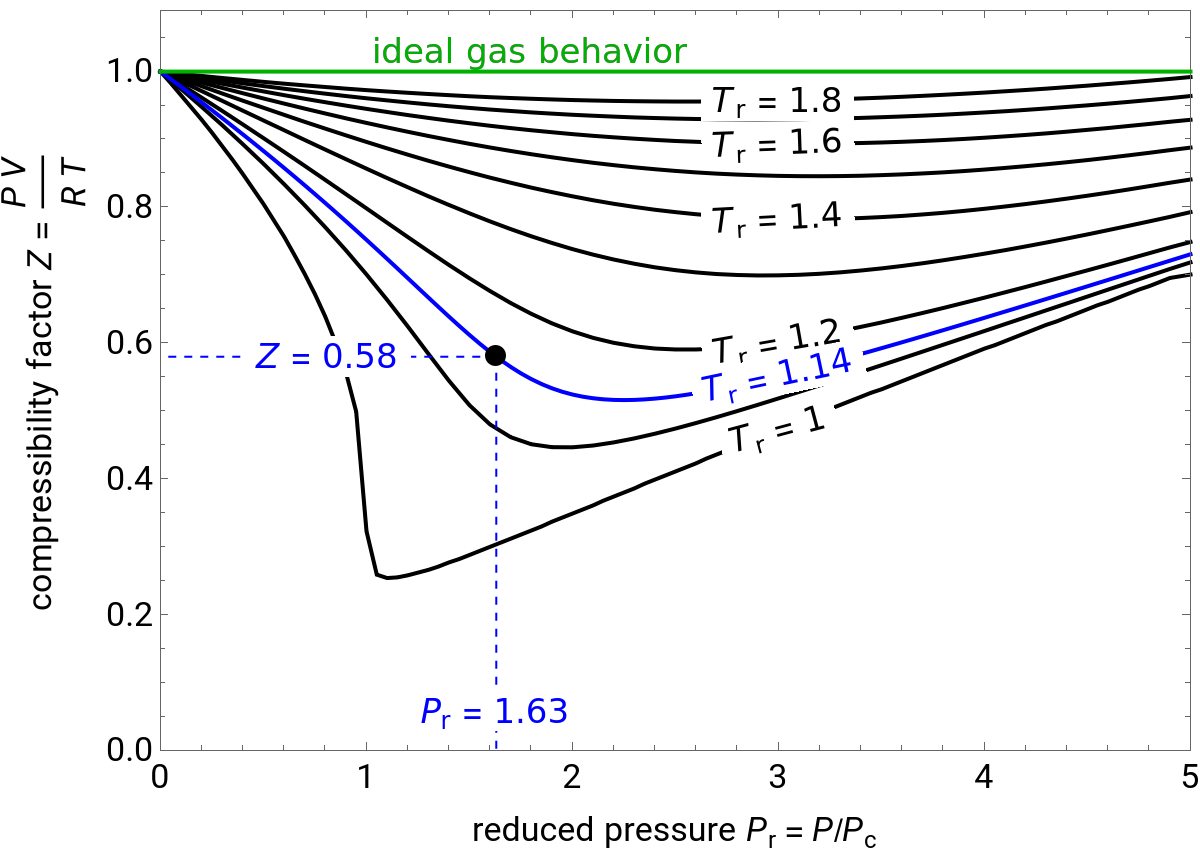
The compressibility factor chart plots the compressibility factor , equal to , where is the volume per mole, versus the reduced pressure for several values of the reduced temperature . The reduced pressure and temperature are defined by =P/ and =T/, respectively, where is the critical pressure and is the critical temperature. Use buttons to select one of five molecules, and move the black dot to display the compressibility factor curve (blue) for any value of between 1.0 and 1.8. The and values for the location of the black dot are displayed on the chart. For an ideal gas, (green line).
Z
PV
RT
V
P
r
T
r
P
r
P
c
T
r
T
c
P
c
T
c
T
r
Z
P
r
Z=1
Details
Details
The Soave modification of the Redlich–Kwong (SRK) equation of state is used to calculate the compressibility factor:
P=-
RT
V-b
aα
V(V+b)
This equation can be written in terms of the reduced temperature =T/:
T
r
T
c
P=-
R
T
r
T
c
V-b
aα
V(V-b)
where is pressure (bar), is the ideal gas constant (bar/molK), is temperature (K), is the critical temperature (K), is volume (/mol), and , and are constants:
P
R
3
cm
T
T
c
V
3
cm
a
b
α
a=0.427α
2
R
2
T
c
P
c
b=0.087
R
T
c
P
c
α=
2
(1+κ(1-))
T
r
where is the critical pressure , and is the acentric factor.
P
c
κ=0.48+1.574ω-0.176
2
ω
ω
The compressibility factor is defined by:
Z=
PV
RT
External Links
External Links
Permanent Citation
Permanent Citation
Rachael L. Baumann, John L. Falconer
"Compressibility Factor Charts"
http://demonstrations.wolfram.com/CompressibilityFactorCharts/
Wolfram Demonstrations Project
Published: May 17, 2017