Building a suite of learning analytics tools for STEM education
by Aneet Narendranath, PhD, Michigan Technological University,
Sid Gopujkar (GTA), Michigan Technological University
by Aneet Narendranath, PhD, Michigan Technological University,
Sid Gopujkar (GTA), Michigan Technological University
ABSTRACT
ABSTRACT
I describe part of a learning analytics tool (LAT) that can plug and play into my curriculum. The following capabilities are being developed:
◼
An Monte-Carlo sampling type forecast model for exam performance of an entire class.
◼
Time on task visualization to identify common failure modes.
◼
A clustering module for the recognition of improperly categorized grades.
◼
A Markov model to evaluate time to mastery.
Current Story (Pain Point)
Current Story (Pain Point)

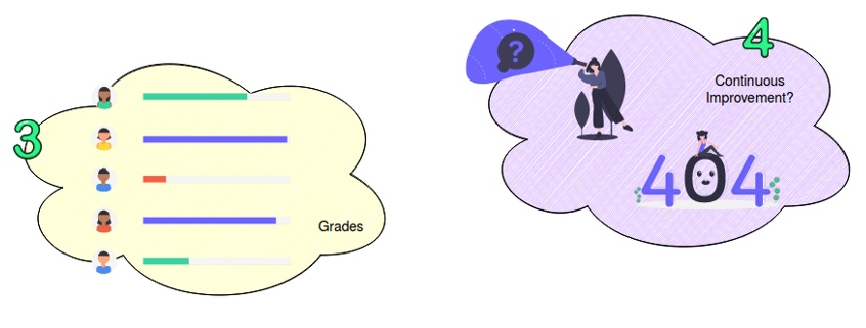
Image created with vector graphics from undraw.co
Letter Grades may not be representative of mastery, have arbitrary granularity, do not provide adequate feedback to students or may not provide adequate actionable intelligence to instructors. They may represent a single, distilled data point with an unstructured support.
Desired Story (Resolution)
Desired Story (Resolution)
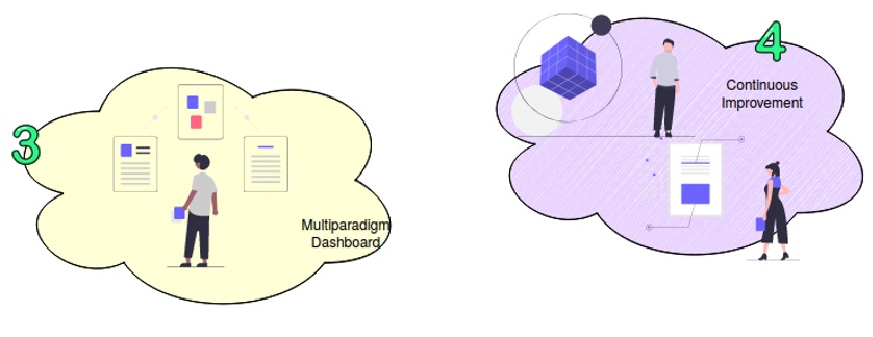
Image created with vector graphics from undraw.co
Student performance on exams results in multi-paradigm data. It is necessary to “pipeline” all (or as many) different pieces of assessment/performance data generated to create a “more rounded” and “coherent” picture of student/s progress and provide actionable intelligence to an instructor.
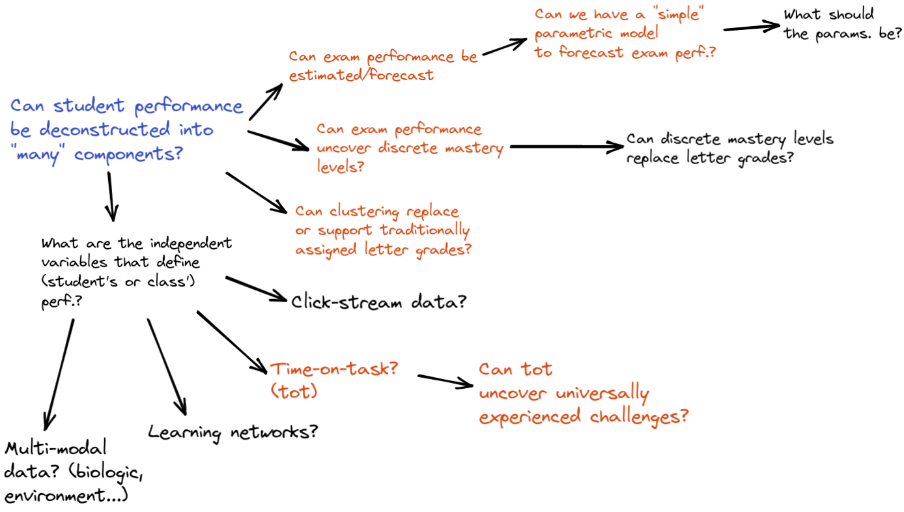
What are the questions I am trying to answer?
What are the questions I am trying to answer?
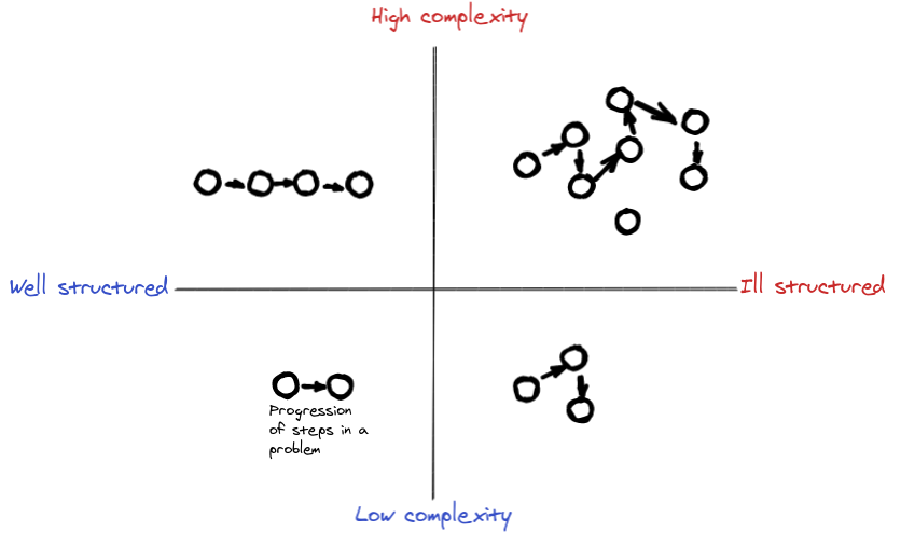
Exam Design: Where on this map do exam problems lie?
Exam Design: Where on this map do exam problems lie?
Student performance on traditional vs structured/hierarchical exam (actual data)
Student performance on traditional vs structured/hierarchical exam (actual data)
In[]:=
SetDirectory[NotebookDirectory[]]scoreThresh=90;(*Servesasavisualizationguide--guidestheeyes*)data=Import["https://raw.githubusercontent.com/dnaneet/WTC/master/2021/all.csv","CSV"];data[[1,All]]=Table[data[[All,i]],{i,1,11}];
Out[]=
/home/dnaneet/Research_4.0/WTC/2021/showcase
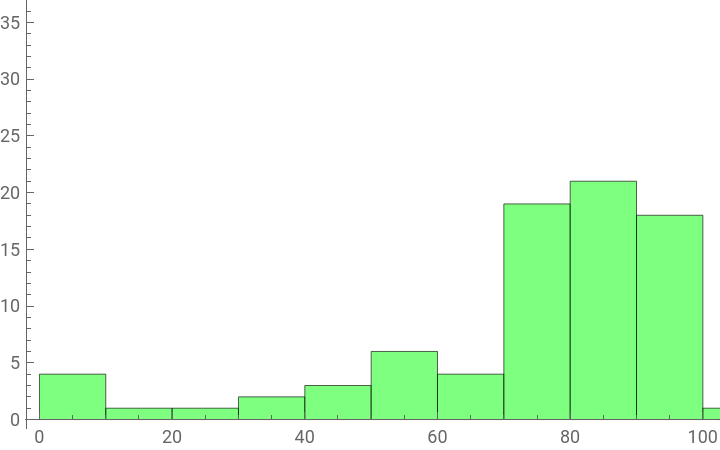
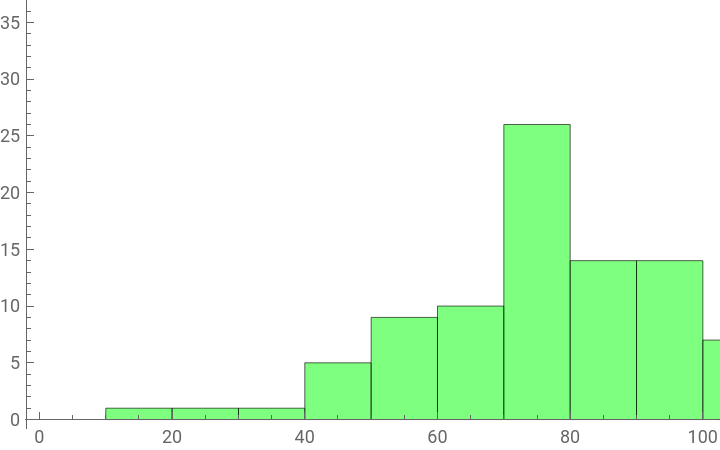
Scores on three Traditional Exams (Spring semester ‘19)
Scores on three Traditional Exams (Spring semester ‘19)
In[]:=
Table[Histogram[data[[All,i]],10,PlotRange{{0,100},{0,35}},ImageSizeMedium,BaseStyle{FontSize20},ChartStyleDirective[Green]],{i,4,6,1}]
Out[]=
,
,
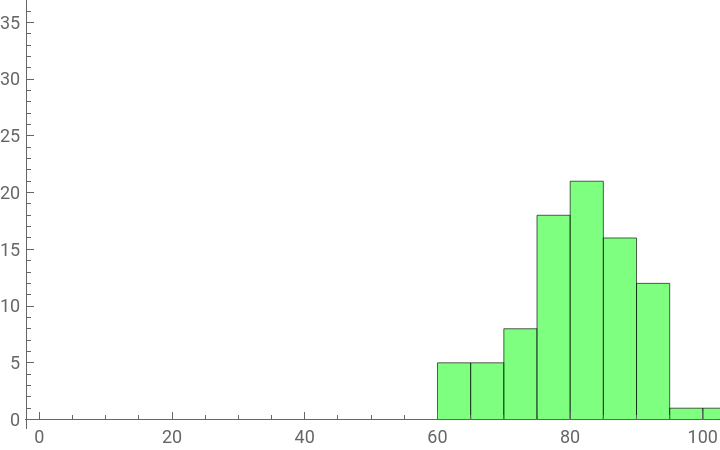
Scores on three Hierarchical Exams (Spring semester ‘21)
Scores on three Hierarchical Exams (Spring semester ‘21)
A greater number of students achieved 100 % on exams that were hierarchical (“achievement of each level is built on the level before that”) in structure.
Replacing Histograms with KDE plots
Replacing Histograms with KDE plots
◼
KDE Plots could present a characteristic curve of student exam performance coupled to assessment structure.
◼
The shape of the KDE plot is coupled to the underlying exam structure, i.e. “traditional” or “Hierarchical”.
Traditional exams
Traditional exams
Hierarchical exams
Hierarchical exams
Hierarchical exams (HE) have fewer discrete score levels than traditional exams
Hierarchical exams (HE) have fewer discrete score levels than traditional exams
With HEs, each discrete “score” is a signature of mastery of some concept. Fewer discrete scores can help with diagnosis and identification of conceptual deficiencies or exam design issues, with some of these LA tools described.
Forecasting the exam performance of an entire class section
Value Add: Possible identification of concept deficiency if actual performance deviates from forecast.
Can we estimate students’ exam performances with a parametric model?
Can we estimate students’ exam performances with a parametric model?
Since Hierarchical exams are constructed to provide “discrete levels”, it is possible to create a crude yet effective Monte-Carlo sampling function. This function has a heuristic parameter called “Exam difficulty.” Driven by this parameter, it can create an ensemble of KDE curves.
Forecast KDE curves (Performance Curves) given an exam “difficulty”
Forecast KDE curves (Performance Curves) given an exam “difficulty”
Fitting an ensemble of curves to Exam-1
Fitting an ensemble of curves to Exam-1
Using the performance curve model to forecast exam-2 and exam-3 performance
Using the performance curve model to forecast exam-2 and exam-3 performance
I observed that Exam-2 and Exam-3 were of lesser difficulty than exam-1. They had similar KDE curves.
A sneak peak at a performance dashboard
A sneak peak at a performance dashboard
“Time-on-task” and what does it tell me?
Value Add: May help identify conceptual deficiency or exam design deficiency, when used in conjunction with forecast model.
Exam performance in terms of “Time-on-Task”
Exam performance in terms of “Time-on-Task”
Traditional Exams
Traditional Exams
“Time-on-task” on exams looks/looked like
Hierarchical Exams with questions of incremental difficulty
Hierarchical Exams with questions of incremental difficulty
The curious case of E1 being more difficult than E2 and E3: Time-on-task metric
The curious case of E1 being more difficult than E2 and E3: Time-on-task metric
What was curious that on Exam-1 (E1Time) problem #4 consumed students between 45-70% of the total time they spent on the exam. Problem #5 (which required greater mastery) consumed less time than problem 4. This is possibly because of lack of prerequisite knowledge in Linear Algebra that was required to quickly complete problem #4.
KMeans Clustering of Grades
Value Add: Identification of possible miscategorization of student work in an n-Dimensional gradebook.
A sneak peak at KMeans Clustering instead of letter grades
A sneak peak at KMeans Clustering instead of letter grades
In this “sneak peek”, I demonstrate that letter grades can be an inadequate indicator of student performance. Using KMeans clustering, it can be shown that it is possible to miscategorize “C” students as “F” students.
Markov Model for expected "number of attempts" for mastery
Value Add: Work-in-progress tool for exam design and mastery.
This is predicated on that the parametric performance model strongly maps to mastery.
I simulate the performance of a class of 50 students on an exam with difficulty 0.9. I then replace their discrete scores with mastery levels 1 4 (i.e. discrete scores are replaced by cardinal levels 1 -4 via {01,502, 602, 703, 803, 904, 1004}.
For a given exam difficulty, the ListStepPlot is a signature of how many attempts would the entire class collectively require to attain different mastery levels.
Exams of higher difficulty have larger number of stairs.
Exams of higher difficulty have larger number of stairs.
Summary
Summary
I demonstrated 4 pieces of a possible Learning Analytics dashboard that would:
◼
forecasting class performance on an exam.
◼
Time-on-task metric to identify possible deficiencies in knowledge.
◼
K-Means clustering to support traditional letter grade assignment.
◼
A Markov model to forecast “number of attempts before mastery”
Modules
Modules