WRI Budget Forecast vs WL Price
WRI Budget Forecast vs WL Price
nPrimaryEducationStudentsUSA=50000000;(*Sorry,restofworld,butImustapproximateforbrevity*)chanceStudentPays250=0;chanceStudentPays5=0.9;revenueAt250=nPrimaryEducationStudentsUSA*chanceStudentPays250*250;revenueAt5=nPrimaryEducationStudentsUSA*chanceStudentPays5*5;WRIRevenueNow=100000000;BarChart[{WRIRevenueNow+revenueAt250,WRIRevenueNow+revenueAt5},ChartLabels{"Greedy($250)","Smart ($5)"},ChartStyle{Red,Green},AxesLabel->"Revenue ($$)",PlotLabel->"WRI Revenue Under Different Pricing Strategies"]
Out[]=
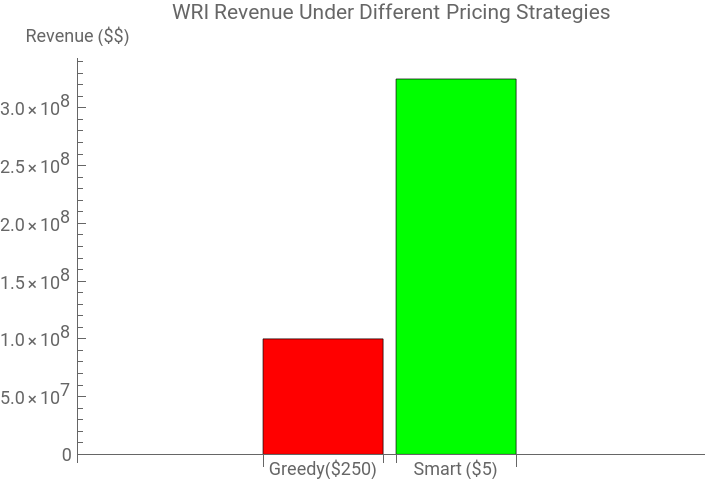
Honestly, hasn’t this lesson already been learned from Wolfram Alpha? Cheap (and therefore widely accessible) software can be quite profitable.