In[]:=
ListLinePlot[{{0,217.3000030517578`},{15,158.83999633789062`},{42,248.83999633789062`},{43,237.8699951171875`}},ImageSize{128,128},Frame->True,Axes->False,TicksFalse,AspectRatio1,PlotMarkers{{●,2}}]
Out[]=
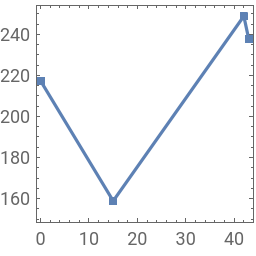
This is what I get when the chart above is part of a number of charts being printed with a ListLinePlot command of the form:
Table[ListLinePlot[coordinates[[n]],ImageSize{128,128},Frame->True,Axes->False,TicksFalse,AspectRatio1,PlotMarkers{{●,2}}],{n,1,Length[coordinates]}];
A=,,,
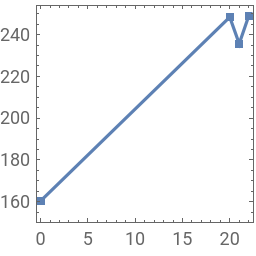
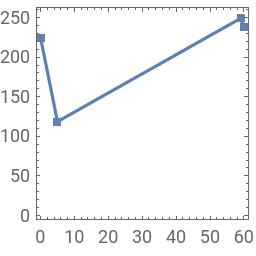
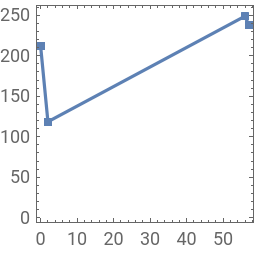
The images above are actual output of my code (I actually plot 200 such images, with one ListLinePlot[] function call. most of the charts use the whole image but some do not, even though I use the same ImageSize{128,128} and an AspectRatio1.
Any idea as to what I am doing wrong?
And also, how can I remove the tick marks and numbers (X and Y values) so that the image is simply surrounded by a simple black frame. I was under the impression that Frame->True, Axes->False,TicksFalse would have done the trick
Any idea as to what I am doing wrong?
And also, how can I remove the tick marks and numbers (X and Y values) so that the image is simply surrounded by a simple black frame. I was under the impression that Frame->True, Axes->False,TicksFalse would have done the trick