This essay was written as part of the Wolfram Emerging Leaders Program: Undergraduate, which is a year long, project-based program designed for gifted undergraduate students to take a deep dive into a topic of their choice. Students work remotely to take their project from ideation to completion, with the guidance of Wolfram experts. Wolfram Emerging Leaders Program participants are selected from the Wolfram High School Summer Research Program or the Wolfram Summer School, which is open to talented, STEM-oriented students.
What is Soft Power?
What is Soft Power?
In an evolving interdependent world, countries are much more likely to shift their priority into maintaining and strengthening relations with other states in order to achieve their agenda, rather than relying on brute-force military strength. This ability to attract states and influence their actions, without resorting to military force (hard power), is soft power. An example of the influence of soft power is seen with Cool Japan, where the spread of Japanese games, manga, anime, and fashion that are considered “cool”, has contributed to Japan’s cultural attractiveness and presence in international politics.There are different levels of attraction towards a country, ranging from an individual watching a movie originating from it, to moving there and getting citizenship. (Wu, 2018)The impact of a country’s economy on soft power is a subject of debate. Typically, the wealth of a state is separate (Nye, 1990). However, the wealth of an entity does psychologically influence how attractive the entity is. Moreover, the more wealthy the state, the more means it has to indirectly influence other’s actions. Thus this project did account for GDP when predicting soft power. Culture, political values, and foreign policy are all taken into account when trying to calculate soft power (SoftPower30 Report). Some reports use over 40 variables specifically targeting education systems, digital infrastructure, innovation, human rights, quality of life, environmental policies, and the promotion of democracy, to name a few. As such, there is no clear calculation, an equation to predict with an X digital presence and Y human rights index, a nation’s soft power and influence (especially with all the variables’ nuances). Moreover, much of the research regarding soft power has a lack of transparency in regards to the actual calculations. The definition of soft power itself is flawed, as it is on “western” terms, with variables such as promotion of democracy, as opposed to a more global concept such as quality of life.This project focused on creating a layout to computationally measure soft power, and provide more transparency into the calculations in comparison to previous research. I analyzed four variables -- GDP, international organizational involvement, immigration, and international movie revenue -- as a basic demonstration. With this layout, it is easy to incorporate further variables to provide a more precise statistical analysis and dimension reduction analysis.

Measuring Soft Power
Measuring Soft Power
The following are soft power index rankings of 2022, where each index has a different method of measuring soft power. The one with the most in-depth research would most likely be Portland’s Soft Power 30 Report, as it is cited in numerous studies.
In[]:=
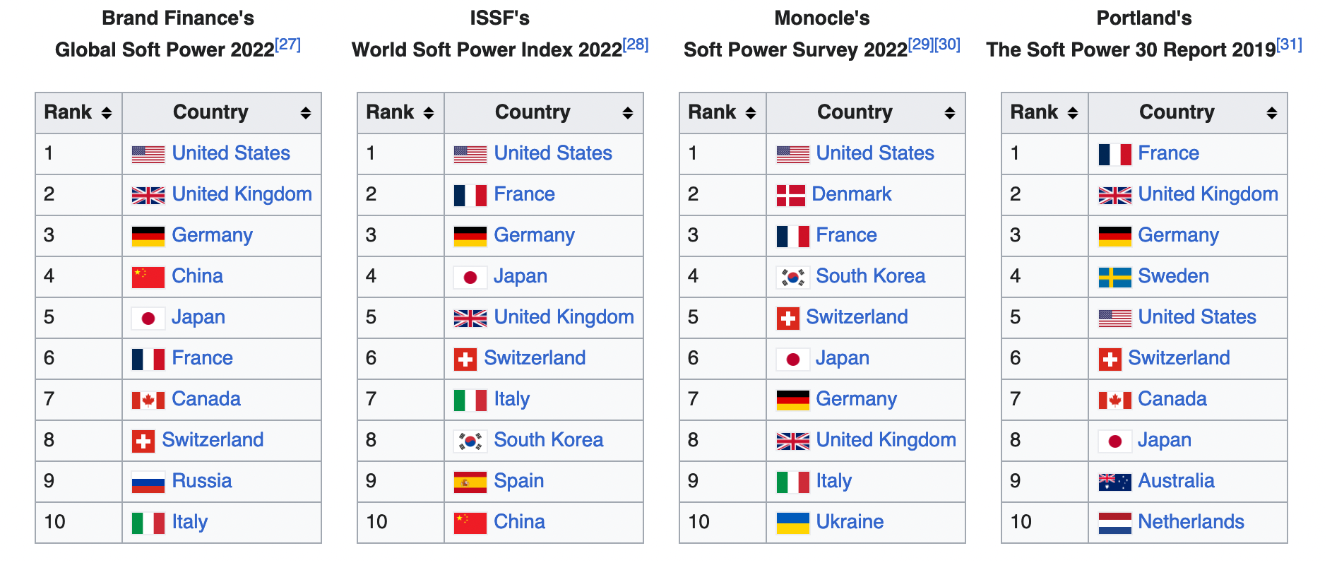
There is definitely some overlap between the indexes: the US, UK, Germany, Japan, France, and Switzerland (the West) make it onto all four charts.
Joseph Nye and Soft Power
Joseph Nye and Soft Power
Joseph Nye is well known for his work on the development of the concept of soft power and his contributions to the field of international relations. The following are items of importance/interest in his research, that helped me solidify the concept (Nye, 1990):
1. Geography, population, and raw materials are becoming less important for spheres of influence, in comparison to technology, education, and economic growth. Power lies in the ability to change the behavior of states.
2. The diffusion of power in a growing interdependent system makes it difficult for the US to control and have leverage over the political environment.
3. To demonstrate the difference between hard and soft power, the United States for instance, might have a goal to enhance energy security and enlarge its petroleum reserve. With hard power, it could send naval forces to the Persian Gulf. With soft power, it could accomplish the same objective by imposing a gasoline tax to encourage conservation at home, and by improving cooperation in institutions like the International Energy Agency.
4. Attractiveness references the ability to affect what other countries want. Attractiveness tends to be associated with intangible power resources such as culture, ideology, and institutions.
5. US has a strong sphere of intangible influence, as seen with Chinese students who used a symbol modeled on the Statue of Liberty during the 1989 uprisings. And although American films account for only 6-7 per cent of all films made (in 1980), they occupy about 50 per cent of world screentime.
Attractiveness of a country influences how much power it has over the political system. The following sections offers a guide to quantitatively measure soft power.
Summary Of Project’s Results
Summary Of Project’s Results
The following is the data that I used to predict a country’s soft power. The data was reported in the past couple of years, specifically 2020, 2022, and 2023. The rest of the notebook will explain how the data was gathered, and offer statistical analysis to see if and how the variables are connected.
GDP (2023)
GDP (2023)
International Involvement (2023 participation in # of international organizations)
International Involvement (2023 participation in # of international organizations)
Immigration (total number of immigrants living in the country as of 2020)
Immigration (total number of immigrants living in the country as of 2020)


International Movie Revenue 2022 (in dollars)
International Movie Revenue 2022 (in dollars)
Measuring GDP
Measuring GDP
GDP influences a country’s soft power. It reflects its economic strength and stability, which enhances its global reputation and attractiveness. Furthermore, a strong economy can create opportunities for international trade and investment that fosters positive perceptions of the country.
This project retrieved the nominal GDP, through the country entity list.
Sorting in descending order:
Top 20 countries, based on GDP:
The United States, China, Japan, Germany, and United Kingdom are the wealthiest countries, as of 2023.
International Organization Involvement
International Organization Involvement
A country’s participation in international institutions determines its capability to shape agendas on a global scale.
How many international institutions and organizations, is the United States a part of?
A lot!
The following totals each country’s international organization involvement:
Afghanistan is part of 45 organizations:
Sorting in descending order:
France, Russia, Germany, United States, and Sweden, lead with the most international influence through institutions.
Measuring Immigration
Measuring Immigration
Immigration is a strong indicator of how well a state’s ideology, culture, and political values are liked, reflecting the extent to which people are drawn to the societal values. I used the United Nations immigration and emigration 2020 dataset, linked here.
I isolated the table that provided the total immigration levels, from an origin country to a destination country, for every five years since 1995. This dataset is very comprehensive, and accounts for immigration numbers in all regions, as well as countries.
Total number of data points:
Dataset form:
There are 28 factors (columns) that the dataset accounts for.
Isolate columns of focus -- mainly country of origin and country of destination in 2020:
Getting the rest of the data for these variables:
The following code counts the number of times each region or country is mentioned. This is the first step towards isolating individual states, from regions such as “Latin America and the Caribbean”:
All countries, regions, territories, and categorizations:
There are 195 total countries. The United Nations dataset accounts of an additional 88 regions:
The goal is to see the total number of immigrants living in a country, as of 2020. To do this, we go through each individual key, and look up at the number of people that emigrated there from the WORLD code (total number of immigrants into the destination country).
Looks up index of destination country:
Row numbers of when the United States is mentioned as a destination country):
We want the row with origin “WORLD”:
Looking at the first row, the United States had around 50 million immigrants living inside the country as of 2020.
Going through each individual destination country and region:
Sorting in descending order by number of immigrants:
Isolating countries:
The United States, not surprisingly, is #1, followed by Germany, Saudi Arabia and Russia.
Films!
Films!
A lower level degree of attraction and commitment towards a country, can be measured by watching a movie originating from it.
My goal was to sum up the international revenue amounted for each country, using the top 200 films of 2020. It is also possible to sum up the total revenue for films in the past couple of years.
The desired dataset structure:
The desired dataset structure:
The country with the most international revenue (revenue not domestically inside borders) would correlate to a stronger degree of soft power.
This part of the project webscraped Box Office Mojo 2020, which provides detailed descriptions on the distributions of revenue each movie in the top 200 earned.
“Domestic” here, refers to the United States.
Importing top 200 movies in 2020:
Hyperlinks:
There are indeed 200 hyperlinks:
Sanity check, to make sure the first hyperlink links to the first movie, and the last hyperlink to the 200th movie.
Importing text:
There were four revenue categories for #1 movie in 2020 : domestic, Europe, Asia Pacific, and China:
Text for all 200 movies:
Demonstration of isolating individual states and revenue:
Now that we can work with individual country revenue, how do you determine the country of origin for a movie?
The text descriptions do not list it. If you follow several more hyperlinks, you reach a page with the origin country/producer. Because there are many acronyms for the producer companies, this approach would have resulted in basically looking up the origin by hand. So instead, I made an assumption that the maximum revenue of a movie would be domestically. I would simply isolate the country with the maximum revenue for a movie, and the rest would be counted as international. This works most of the time, but not all, especially in the case where movies have multiple creators such as Tenet jointly produced by the US and UK.
The text descriptions do not list it. If you follow several more hyperlinks, you reach a page with the origin country/producer. Because there are many acronyms for the producer companies, this approach would have resulted in basically looking up the origin by hand. So instead, I made an assumption that the maximum revenue of a movie would be domestically. I would simply isolate the country with the maximum revenue for a movie, and the rest would be counted as international. This works most of the time, but not all, especially in the case where movies have multiple creators such as Tenet jointly produced by the US and UK.
Sorting my maximum revenue, to determine country of origin:
Sometimes, a movie only has one continent of revenue, which makes the formatting of the data not uniform. I created a switch statement, to account for the variations.
determineOriginCountry isolates the maximum revenue, and assigns the origin country.
After determining origin country with maximum revenue, sum up the remaining entities for international revenue (again the switch statement):
The international revenue of the #1 film of 2020 -- The Eight Hundred was $1.42 million. Most of the revenue, 460 million, however, came within the country of origin China.
Origin and international revenue of the #2 film of 2020: Demon Slayer the Movie: Mugen Train:
Japan received a total of 88 million internationally for its Demon Slayer the Movie: Mugen Train.
Now, we need to sum up the totals for each country. To do this, we create an association with the country of origin, followed by list of all it’s films and respective international revenue.
(the error messages are due to the fact that some countries have an empty list for international revenue - ie all revenue is domestically)
Summing up totals:
The US is #1 with 1.3 billion in international revenue, followed by China and France. It makes sense that Japan also has a large revenue with it’s worldwide popularity with anime, as well as South Korea with k-dramas. It is interesting, that only so many countries had an impact on international revenue in 2020. You would expect there to be more.
Vietnam, Netherlands, and Brazil, had movies in the top 200, but all the revenue was inside the country itself therefore had international revenue of 0.
Vietnam, Netherlands, and Brazil, had movies in the top 200, but all the revenue was inside the country itself therefore had international revenue of 0.
Analysis
Analysis
I wanted to see if and how the variables -- GDP, international organization involvement, immigration, and movie revenue -- are connected.
Principal component analysis (PCA) is useful when dealing with many variables, as it helps identify and isolate independent variables, from ones that strongly correlate to one another and thus are redundant in calculations.
The specific steps for principal component analysis are detailed here. Basically, you:
1. Compute the covariance N by N matrix (where N is the number of variables), to determine the degree of correlation between the variables.
2. You compute the eigenvectors and eigenvalues of the covariance matrix. These eigenvectors represent the principal components, and the corresponding eigenvalues indicate the amount of variance along the eigenvectors. Higher eigenvalues capture more variance in the data, and thus are more significant.
Graphing the data along the eigenvectors creates simplified version of the data, that attempts to preserve the maximum amount of the original information.
Rewriting data to match the ideal format for PCA where you have a list of countries, and then lists of the variables that respectively correlate to those countries:
Movie revenue:
GDP:
International organization involvement:
Immigration:
Sanity check:
We can first see if certain variables correlate to each other, by plotting one variable on the x-axis and the other on the y-axis.
For example, GDP v. Immigrants:
(top right United States). With the exception of China, there does seem to be positive linear correlation between GDP and number of immigrants living in the country.
All 2-Variable Graphs
All 2-Variable Graphs
There are four unique variables, which would result in 12 total graphs with all the possible combinations of two variables.
Removing the country point labels, so that the patterns are easier to spot:
GDP v. International Organizations:
In this case, there does not seem to be much correlation between GDP and international organizations involvement. GDP stays relatively constant at around $2.50 * 10^12 for most of the countries (except China and the United States) regardless of international organization involvement.
Plotting the remaining variables:
International organizations does not seem to correlate strongly with the other variables, so therefore in a principle component analysis, would be regarded as a principle component and independent variable.
On the other hand, there is a more significant linear correlation between GDP, and movie revenue as well as immigration.
On the other hand, there is a more significant linear correlation between GDP, and movie revenue as well as immigration.
Dimension Reduction
Dimension Reduction
This project used the DimensionReduce function, to reduce the dimension of the four variables into a single dimension, so that all the components could be plotted on a line.
GDP and International organization involvement have the highest significance, each with absolute value of five. These two, out of the four, are most likely to predict soft power. On other hand, immigration and movie revenue, have lower values at 0.33 and 0.12, meaning that they are already dependant on another variable (GDP), and thus do not offer much new representation.
Conclusions and Future Work
Conclusions and Future Work
Soft power is such an interesting concept, especially due to its lack of tangibility. This project created an outline for computationally quantitatively measuring soft power. Future work would incorporate more variables and datasets.
Using Dimension Reduction, GDP and international organizational involvement were found to have the most sway towards soft power:
Overlap in these datasets includes ✨ France, Russia, Germany, the United States, Italy, the United Kingdom, India, Spain, Canada, and Brazil ✨. Because it is difficult to measure the reach and tangible influence of soft power, it is not trivial to assign specific weights to the two variables, to determine the ordering of these countries.
In general in the field of soft power, future work would offer an increased transparency in how the soft power score is calculated. The SoftPower30 project provided remarkable research, yet it's still difficult to grasp the quantitative process. The other three, Brand Finance's, ISSF's, and Monocle's soft power reports seem to be particularly biased towards the United States.
Acknowledgements
Acknowledgements
I’d like to give a big thank you to my mentor Megan Davis for their feedback, guidance, and support! I am grateful to have been able to conduct research through WELP:U, and would like to thank Rory for the opportunity.
Works Cited
Works Cited
◼
Jaadi, Z. (n.d.). Step-by-Step Explanation of Principal Component Analysis. Builtin.com. Retrieved from https://builtin.com/data-science/step-step-explanation-principal-component-analysis
◼
Nye, J. S. (1990). Soft Power: The Means to Success in World Politics. Foreign Policy. https://www.jstor.org/stable/pdf/1148580.pdf?refreqid=excelsior%3Aca9c46e2db55c5fdcfdcef6af08563de&ab_segments=&origin=&initiator=&acceptTC=1
◼
Soft Power 30. (2019). The Soft Power 30 Report 2019. Retrieved from https://softpower30.com/wp-content/uploads/2019/10/The-Soft-Power-30-Report-2019-1.pdf
◼
United Nations Department of Economic and Social Affairs, Population Division. (2020). International Migrant Stock 2020: Documentation. Retrieved from https://www.un.org/development/desa/pd/sites/www.un.org.development.desa.pd/files/undesa_pd_2020_international_migrant_stock_documentation.pdf
◼
Wu, I. (2018). Measuring Soft Power with Conventional and Unconventional Data. National Academies of Sciences, Engineering, and Medicine. Retrieved from https://sites.nationalacademies.org/cs/groups/dbassesite/documents/webpage/dbasse_179613.pdf
CITE THIS NOTEBOOK
CITE THIS NOTEBOOK
A glimpse into quantitatively measuring soft power
by Yana Outkin
Wolfram Community, STAFF PICKS, August 14, 2023
https://community.wolfram.com/groups/-/m/t/2989803
by Yana Outkin
Wolfram Community, STAFF PICKS, August 14, 2023
https://community.wolfram.com/groups/-/m/t/2989803