Abstract
Abstract
In this project, patterns within the nested recursive functions were investigated. The project first involves creating tree diagrams of called values, where tree diagrams are built with variable functions where the variables are changeable. After that, within specific ranges of the variables, patterns of the called values are investigated, where negative values show exponential decrease under specific variable conditions. Patterns regarding changes of other variables are also introduced.
Introduction
Introduction
Recursive functions are functions that includes procedures where it yields specific values or instances of the function itself by repeatedly applying a specific routine or relation to the operation. The theory of recursive functions was developed by the 20th-century Norwegian Thoralf Albert Skolem, when the idea of applying infinite cycles within a function. Among the four types of recursion, a nested recursive function passes the parameter as a recursive call. This means that the recursion would happen inside a recursion. Therefore, a nested recursion involves an indefinite loop, where the iterator is not defined in a specific domain, such as for loops. The idea for this project is derived from a Wolfram simulation of nested recursive function, where the tree diagram and a line plot drawn for specific nested recursions.
Creating Tree Diagrams of Called Values
Creating Tree Diagrams of Called Values
To create tree diagrams of called values, the following function was defined, where function f would produce the called values within itself, with a specific range and variables defining the function. The equation is , with input values of n from 1 to nrange. Any value of n that is less than 1 (0 and negative values) were defined as , since there would be an infinite loop of called values without this limit. The function Sow is used to call the values within the recursive function, where the function would first call n-1, and then refer to n-1f(n-1), which is the next value called. After that, these values will be outputted using the function Reap, where it is stored in listrecall.
f(n)=a*f(n-b*f(n-c))
f(n)=1
listrecall=Flatten[Delete[Reap[Module[{f},f[n_]:=f[n]=3*f[Sow[n-1f[Sow[n-1,n]],n]];f[n_/;n<1]=1;f/@Range[30]]],1],1];
Out[]=
This function was then plotted on a tree with varying constants, where a, b, and c range from 1 to 10, and nrange would range from 1 to 100, with integer values. These defined variables were then applied back to the function and created a tree plot of called values within the function. In order to create sliders that would match the condition of these variables, the Manipulate function was used to project the treeplot with freely moving sliders for each variable and range of the input.
In[]:=
Manipulatelisti=Flatten[Delete[Reap[Module[{f},f[n_]:=f[n]=a*f[Sow[n-bf[Sow[n-c,n]],n]];f[n_/;n<1]=1;f/@Range[nrange]]],1],1];LabeledTreePlotJoin[#->listi[[#,1]]&/@Range[nrange],#->listi[[#,2]]&/@Range[nrange]],,Text[With[{a=a,b=b,c=c},TraditionalForm[HoldForm[f[n]=a*f[n-b*f[n-c]]]]]],Top,Style[Column[{TraditionalForm[HoldForm[f[n]="a"f[n-"b"*f[n-"c"]]":"]],TraditionalForm[HoldForm[1≤n≤"nrange"]]}],11],
Out[]=


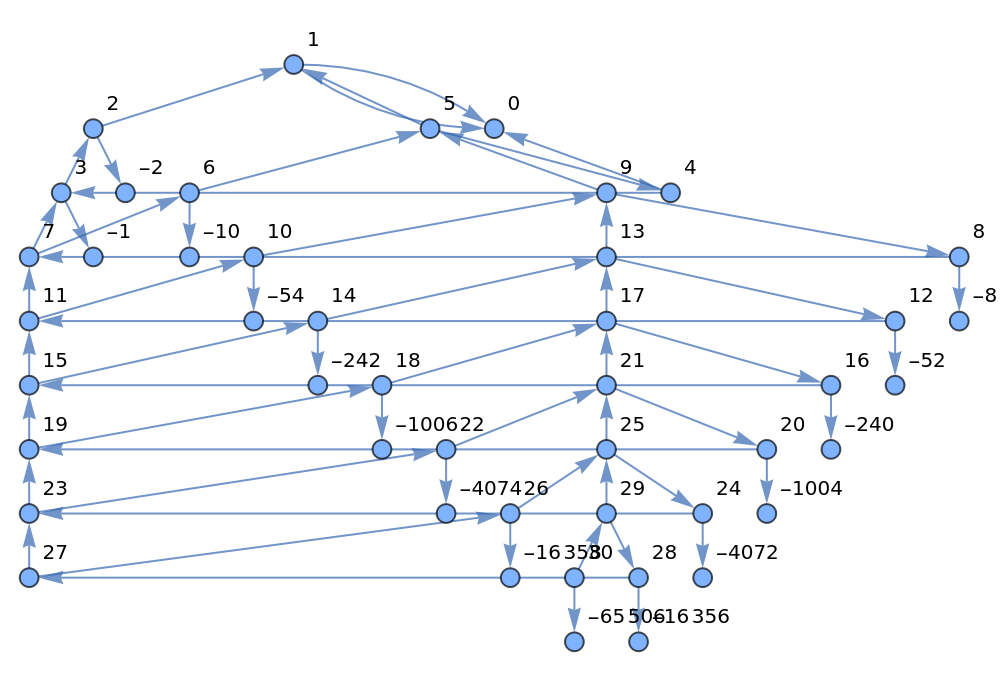
As shown, the values called show a pattern with they call the immediate value before them (n-c), and a unique negative value where it refers to . These patterns of called negative values were then investigated using the changeable parameters of the variables. The extension of range tends to shows more elaborated values, for larger range values such as 100 or 1000.
n-b*f(n-c)
Identifying Patterns of the Called Values
Identifying Patterns of the Called Values
Changing a
Changing a
For even values of a, an example shown below (a=4, b=1, c=1, n=100).
In[]:=
list=Flatten[Delete[Reap[Module[{f},f[n_]:=f[n]=4*f[Sow[n-1f[Sow[n-1,n]],n]];f[n_/;n<1]=1;f/@Range[100]]],1],1];ListLinePlot[Select[list[[#,2]]&/@Range[100],#<0&],ImageSize{500,350},AxesLabel{"n","Negative Values Called"}]
The x-axis shows the original input of the function, and the y-axis shows the value of the negative values called within the function.
Out[]=
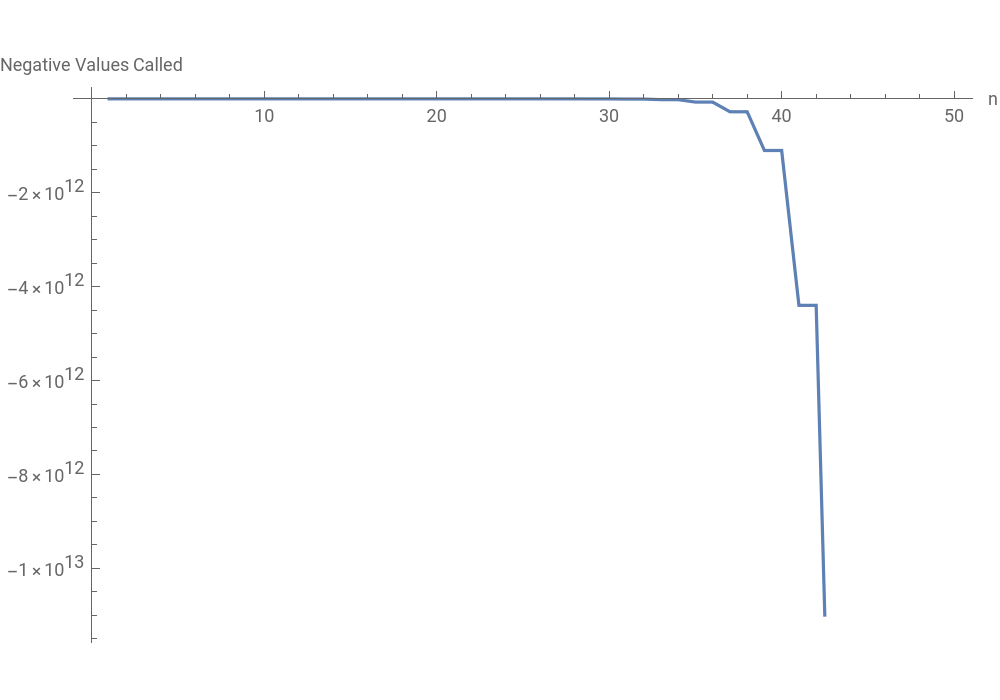
The function was investigated further into the constants of the α and β values of the exponential decrease. The function linreg was defined to output the α and β values for the negative values called. After selecting the negative values using the Select function, the linear model fit generates the α and β values for the exponential decrease. The generation of the function enabled the code to be much shorter, as the blocks of codes from linreg was shorted with a defined value of a.
In[]:=
linreg[a_]:=Module[{list2,f},f[n_]:=f[n]=a*f[Sow[n-1f[Sow[n-1,n]],n]];f[n_/;n<1]=1;list2=Flatten[Delete[Reap[f/@Range[1000]],1],1];CoefficientList[Normal[LinearModelFit[Cases[Select[list2,Last[#]<0&],{x_,y_}{x,Log[Abs[y]]}],x,x]],x]]ListLinePlot{First[linreg[#]]&/@Select[Range[20],EvenQ],Last[linreg[#]]&/@Select[Range[20],EvenQ]},
Out[]=
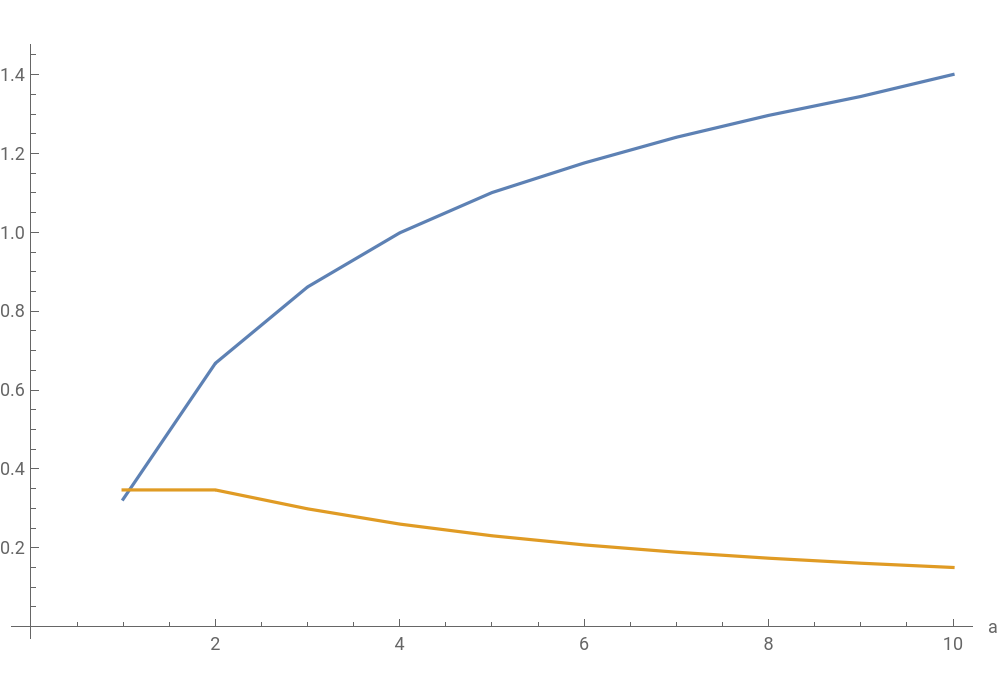


Using the linreg function, the α and β values were plotted using ListLinePlot, where the increase of α values and decrease of β values are shown as a increases. As these values are used in the function , it can be interpreted from this graph that the negative exponent of the function rises while the positive exponent of the function decreases as a increases.
f[x]=-**x
α
e
β
e
In[]:=
ListLinePlot{-(E^First[linreg[4]])*E^(Last[linreg[4]]*#)&/@Range[100],Select[list,Last[#]<0&]},
To test the accuracy of the calculation, an example is plotted below using the same equation, with the linreg function. The shown graph shows that the calculated graph is accurate as it is largely overlapping with the list generated by the nested recursive function. Increasing the range also increase the accuracy of the calculation, as the graphs tend to overlap even more with the increase of the range.
Out[]=
However, this pattern of exponential decrease is not evident for odd values of a, where the plotted graph shows a repetition of extremely small values and big values no matter the range. The code below generates a line plot with the list of the negatively called values, but where a is 3, a odd value.
As shown in this graph, no matter how much the range is increased, the graph does not show any kind of curve or calculated function as before. The range is set to 10,000, which is a sufficient range to show any explicit patterns if one existed.
Therefore, it is conclusive that the nested recursion generates a list of negative integers showing only if a is a even value (assuming that b and c are both 1, which will be further evaluated), and any value of a with a even value produces a exponentially decreasing function when the negative values are collected.
Changing b and c
Changing b and c
The function plotabc generates graphs with different values of a, b, and c, which can be inputted into generate multiple graphs with a shorter code. Different values of b and c were test to check if any increase in these values would affect the pattern while a is equal to a even value.
Instances of the function f is listed below, where each of these graphs have set a, b, and c values. The functions were plotted in a table with two rows and two columns, using the function Multicolumn. As shown below in the graphs, even values of a generally creates an exponential decrease, disregarding any increase in b or c.
The exponentially decreasing pattern of the called values is not constant, as for any increased value of b and c will provide a different shape of graph. The graphs for different values of b and c with odd values of a were tested to show any possible patterns of the negative called values.
The same methods were used to list the graph as above. However, with odd values of a, no matter what the increase of b or c is, it was hard to find a concrete pattern.
Conclusion
Conclusion
During this project, patterns for specific nested recursive functions were explored. The exponential decrease was evident with reliable accuracy, but this trend was limited to certain conditions of the variables. The patterns vastly varied for functions that involved odd values of a or increased values of b and c. The patterns did become more evident when the range of the patterns increased, but there were still limitations in producing a concrete equation for some of the generated graphs. The negative values therefore did not show concrete trend of either increase/decrease as it did for other nested recursive functions.
Limitation
Limitation
For this specific project, the limitation lies with in expanding to constants b and c in the function, where different patterns were observed, but the range of patterns limited the analysis of the overall function. While patterns that were identifiable were thoroughly investigated, the changes from b and c weren't as identifiable were therefore limited in their analysis. Also, this study only regards a certain type of nested recursive function, so there is no guarantee that the patterns in these functions are evident for other forms of nested recursive functions.
Future Works
Future Works
There are also more areas of study within exploring nested recursive function. The changes in constants could be more thoroughly analyzed to produce a definite statement for the called values within the nested recursions. Also, the numbers of constants were limited to 3 (a, b, and c), with a specific position for each. However, this could be extended to find more extensive patterns for different types of nested recursive functions, where factors such as number of constants or the location of constants within the function will likely generate a different result. Producing a general statement/equation for types of nested recursive functions would be a likely extended goal.
References
References
I would like to thank my mentor Matthew for guiding me through this project.
◼
Britannica, The Editors of Encyclopaedia. “Recursive function”. Encyclopedia Britannica, 3 Jul. 2008, https://www.britannica.com/science/recursive-function. Accessed 15 July 2021.
◼
Sparknotes. "What Is Recursion?: Types of Recursion | SparkNotes." SparkNotes, https://www.sparknotes.com/cs/recursion/whatisrecursion/section2/. Accessed 14 July 2021.
◼
"Types of Recursions - GeeksforGeeks." GeeksforGeeks, 27 June 2019, https://www.geeksforgeeks.org/types-of-recursions/.
◼
Wolfram. Call Graphs of Nestedly Recursive Functions - Wolfram Demonstrations Project. 1 Mar. 2011, http://demonstrations.wolfram.com/CallGraphsOfNestedlyRecursiveFunctions/.