In his writing "Games and Puzzles as Multicomputational Systems," Stephen Wolfram explains that "in a multicomputational system the key idea is that states can have multiple successors—and tracing their behavior defines a whole multiway graph of branching and merging threads of time." An everyday example of such multicomputational systems are simple math games, where a player has many paths they can choose to take next during their turn that ultimately affects future turns and later the outcome. In this project, I explored the game Dots and Boxes using multiway graphs to model the connections between a large number of possible game states. While various popular games have been modeled this way, it is significant that the Dots and Boxes board itself is inherently its own graph of vertices and the edges connecting them, resulting in something meta. This project allows the opportunity to trace the evolution of real life systems that are complex and can be modeled by graphs.
Modeling the Game
Modeling the Game
The game Dots and Boxes is a classic pencil and paper game first published by French mathematician Édouard Lucas in the 19th century. It involves a rectangular lattice where two players take turns drawing lines hoping to complete boxes. The game has also become widely recreated online, such as in the iOS app GamePigeon. A variety of sizes and configurations are possible, from 2x2 to 5x5 to non-rectangular shapes.
Rules
Rules
◼
The board starts as an empty grid of dots
◼
Players take turns adding a single horizontal or vertical line between two adjacent dots
◼
When a player completes the fourth side of a 1x1 box, they earn one point and are able to take another turn
◼
The player who has claimed the most boxes once the board is full wins
Example Game
Example Game
Out[]=
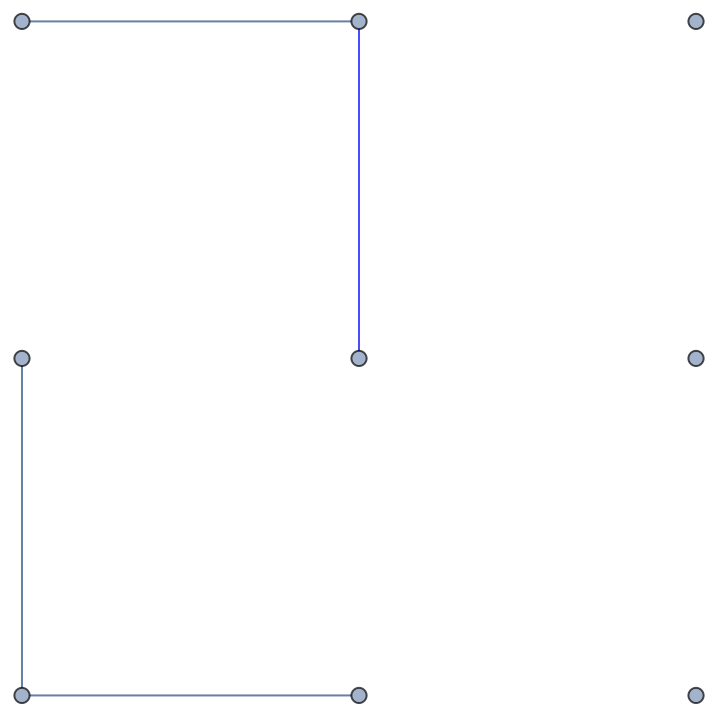
Representing Each “State”
Representing Each “State”
Each dot and boxes game will be represented by it’s various “states” which change every time a turn is made. The “state” of a game includes the game board creating using a graph, the possible moves that could be made next, lists of the boxes won by player 1 and player 2, and which player’s turn it is. In this cell, we create a function to initialize a game, which can be an empty board or with specified moves already made on it.
In[]:=
makeState[]:= <|"Board" ->GraphRange[9], {}, VertexCoordinates -> , "PossibleMoves" -> {12,23, 45, 56, 78, 89, 14,25, 36,47,58,69}, "Boxes1" -> {}, "Boxes2" -> {}, "NextTurn" -> 2|>makeState[edgelist_] := <|"Board" ->GraphRange[9],edgelist, VertexCoordinates -> , EdgeStyle -> Red, "PossibleMoves" -> DeleteCases[{12,23, 45, 56, 78, 89, 14,25, 36,47,58,69}, a_/;MemberQ[edgelist,a]], "Boxes1" -> {}, "Boxes2" -> {}, "NextTurn" -> 2|>
Making Moves
Making Moves
In order to play the game, we need a function that makes moves on a board state. Each time a move is made, an edge is added to the graph and the list of possible next moves changes. If a box was won during that turn, the score and next player is updated accordingly.
In[]:=
makeMove[state_, vertex1_, vertex2_] := Module[{localState = state}, If[localState["NextTurn"] ==1, localState["Board"] = EdgeAdd[localState["Board"], {vertex1vertex2}, EdgeStyle -> {vertex1vertex2 -> Red}], localState["Board"] = EdgeAdd[localState["Board"], {vertex1vertex2}, EdgeStyle -> {vertex1vertex2 -> Blue}] ]; localState["PossibleMoves"] = DeleteCases[localState["PossibleMoves"], vertex1vertex2|vertex2vertex1]; If[localState["NextTurn"] == 1, localState["Boxes1"] = DeleteDuplicates[Join[localState["Boxes1"], Map[Sort, FindCycle[{localState["Board"], vertex1}, {4}, All], 2]]], localState["Boxes2"] = DeleteDuplicates[Join[localState["Boxes2"], Map[Sort, FindCycle[{localState["Board"], vertex1}, {4}, All], 2]]] ]; Which[ localState["NextTurn"] == 1 && Length[FindCycle[{localState["Board"], vertex1}, {4}, All]]== 0, localState["NextTurn"] = 2, localState["NextTurn"] == 2 && Length[FindCycle[{localState["Board"], vertex1}, {4}, All]]== 0, localState["NextTurn"]= 1, True, Nothing];;localState]
Constructing the Multiway Graph
Constructing the Multiway Graph
A multiway graph aims to show the evolution relationship between states of a system, where each possible path to traverse the graph is a possible evolution history for the system (Wolfram, n.d.). For dots and boxes, the multiway graph will show all the possible moves during the game.
Finding Equivalent Boards
Finding Equivalent Boards
While it is possible to map out all the possible moves at every step, it quickly becomes computationally expensive. Given a square dots and boxes board, there are 8 possible transformations (4 rotations, 4 reflections) that could be performed on the board to produce an equivalent state. Rather than considering these boards as unique, I took the top left board to be a “canonical form” of all the other ones and only used that one. For example, the following game boards would be “duplicate” versions of each other, with the first as the default:
Out[]=
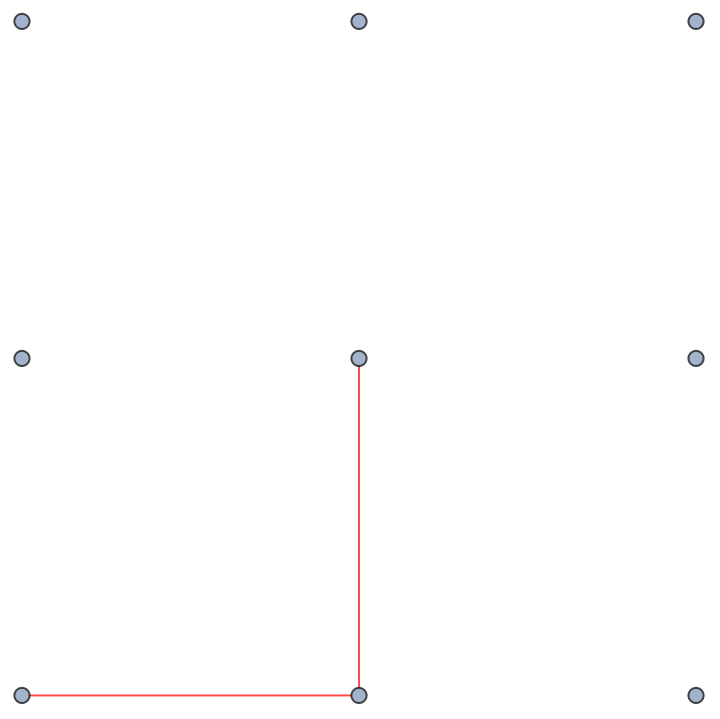
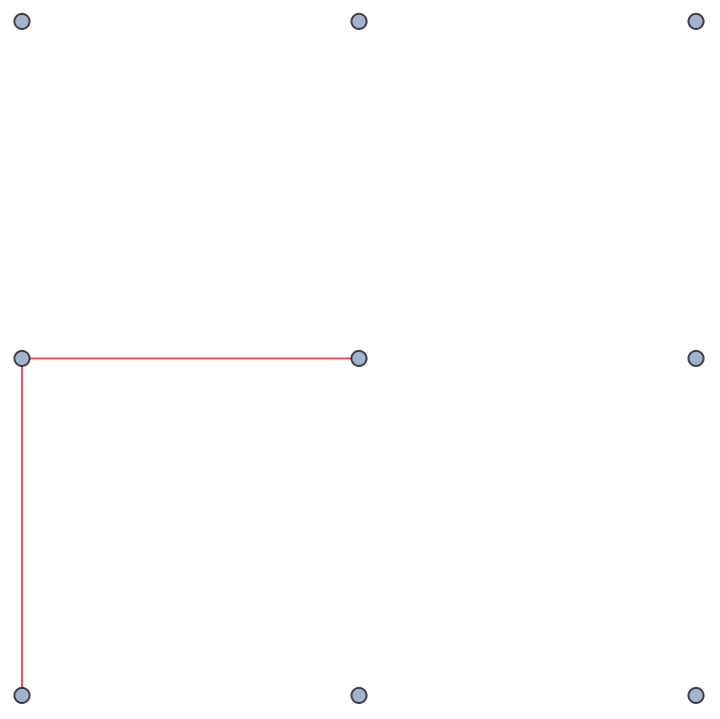
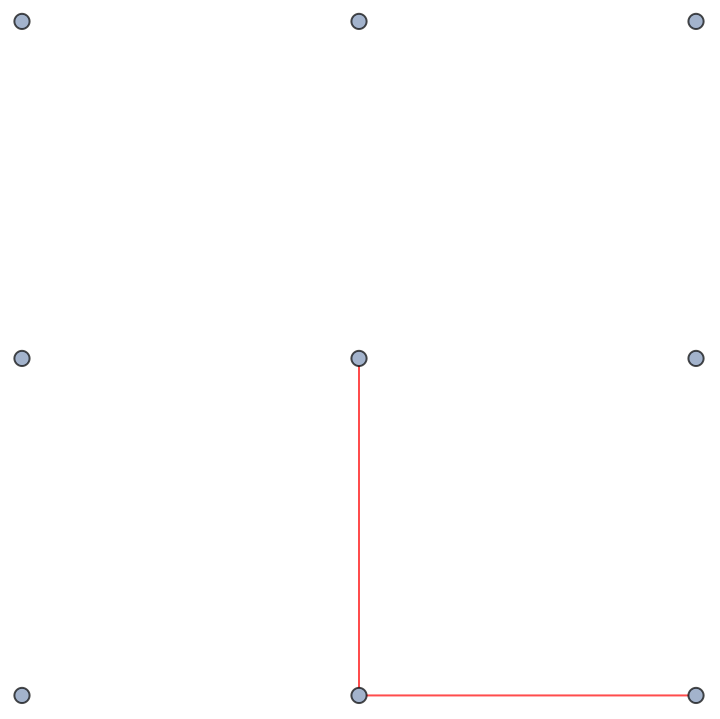
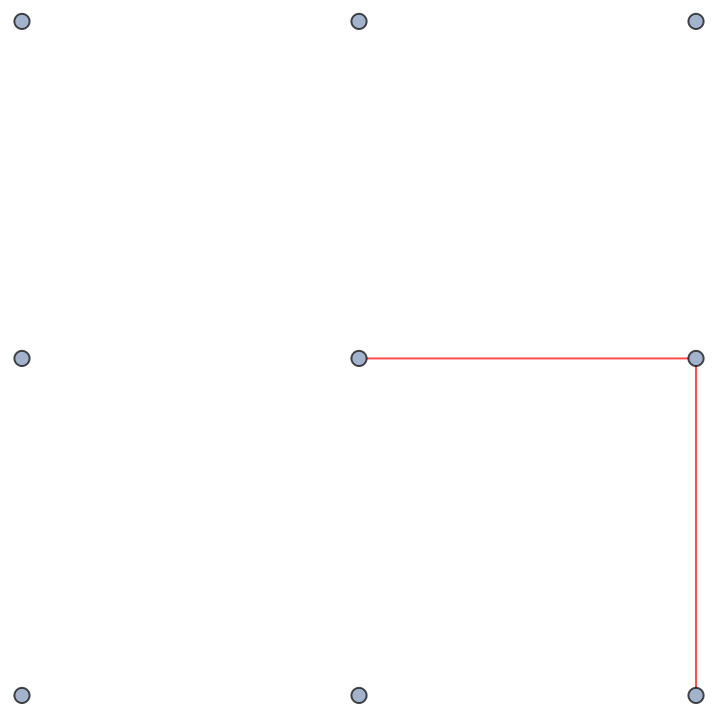
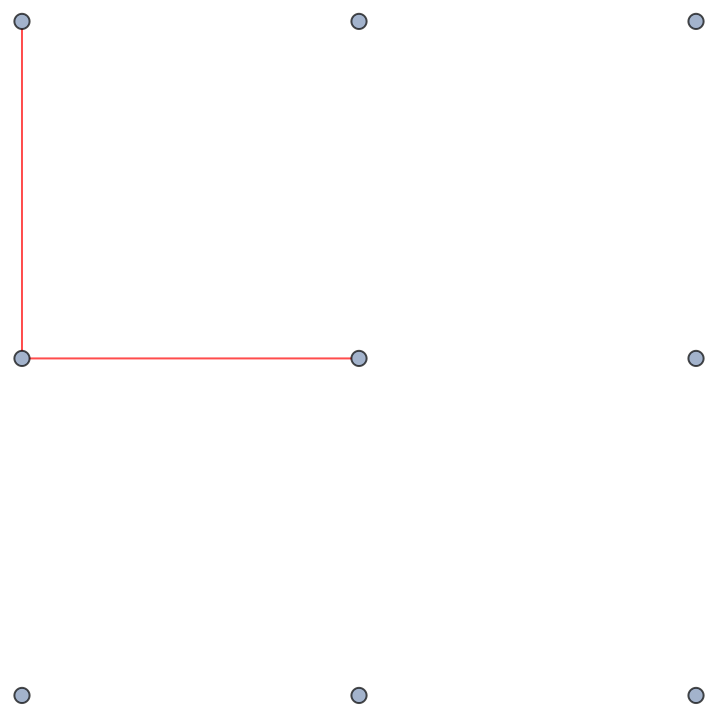
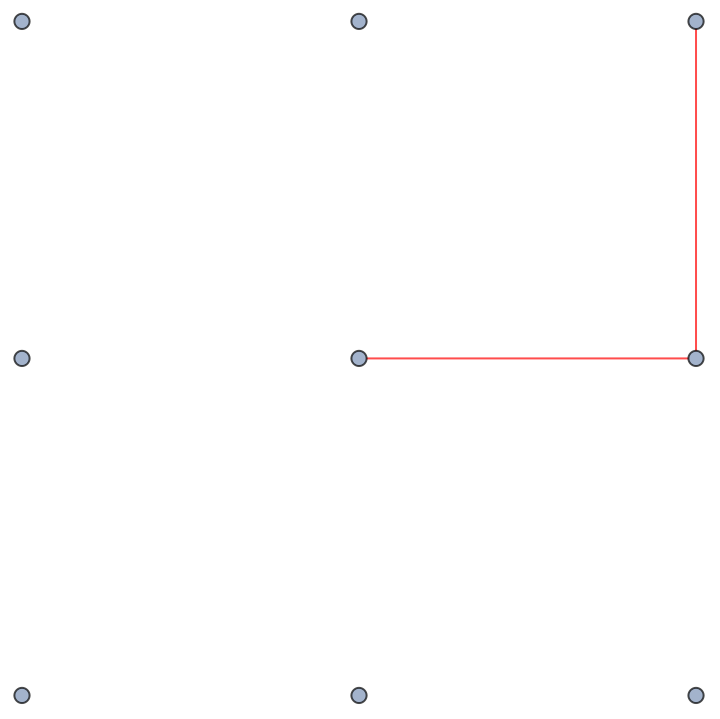
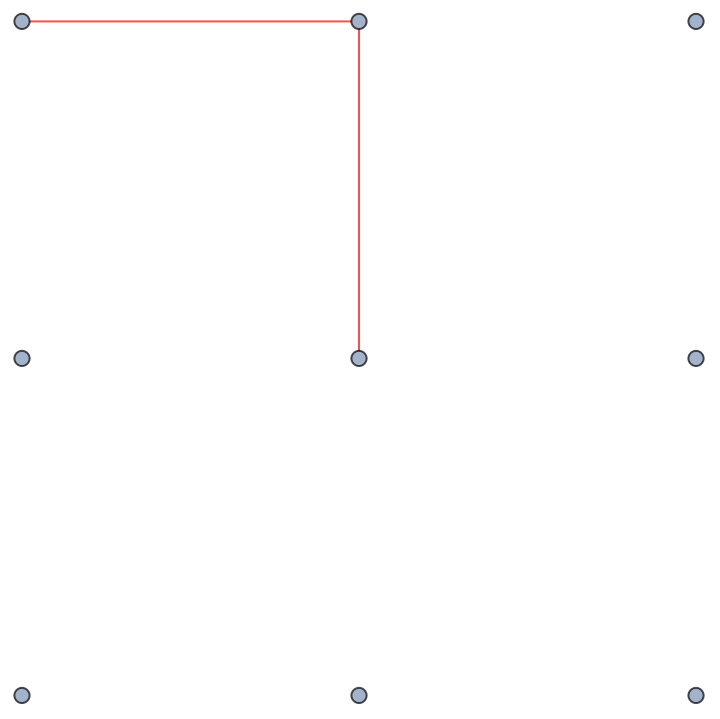
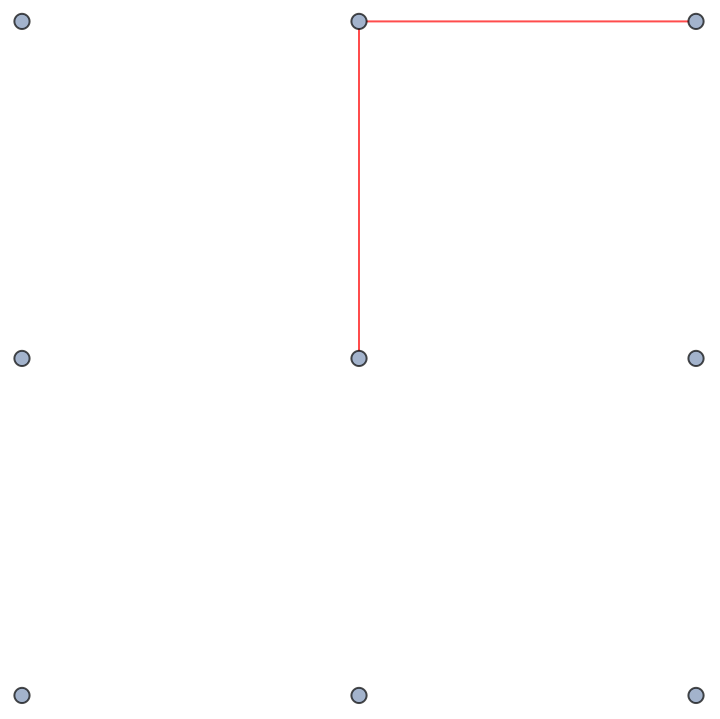
In order to find the transformations of each board, I converted the vertex labels from numbers into coordinate points, selecting the point (0, 0) to align with the center of the board.
In[]:=
tocoordinates = {1 -> {-1,-1}, 2 -> {0,-1}, 3 -> {1,-1}, 4 -> {-1,0}, 5 -> {0,0}, 6 -> {1,0}, 7 -> {-1,1}, 8 -> {0,1}, 9 -> {1,1}};
This function performs the desired transformation on the coordinates and provides replacement rules for vertices of the graph. I applied it to each of the possible transformations of a square.
In[]:=
transform[tocoordinates_, transformation:"rotate"|"flip", degree_] := Thread[Rule[ First/@tocoordinates, If[transformation==="rotate", RotationTransform, ReflectionTransform][degree][ (First/@tocoordinates)/.tocoordinates ]/.Reverse/@tocoordinates]]
In[]:=
rotate90 = transform[tocoordinates, "rotate", Pi/2];rotate180 = transform[tocoordinates, "rotate", Pi];rotate270 = transform[tocoordinates, "rotate", 3Pi/2];fliprdiag= transform[tocoordinates, "flip", {1,-1}];flipldiag= transform[tocoordinates, "flip", {-1,-1}];fliphoriz= transform[tocoordinates, "flip", {0,-1}];flipvert= transform[tocoordinates, "flip", {1,0}];
This helper function returns a list of boards that are equivalent to a given board state.
In[]:=
Clear[findDuplicates]findDuplicates[state_] := Sort[makeState[#]& /@ Map[Sort, EdgeList[state["Board"]] /. # & /@ {{}, rotate90, rotate180, rotate270, fliprdiag, flipldiag, fliphoriz, flipvert}, 2 ]]
Generating Layers
Generating Layers
Now, I am able to start building the multiway graph one layer at a time. The "zeroth" layer would simply be the blank board, which maps out to all the possible unique opening moves. Those moves then connect to potential second moves. This process continues, until the board is filled and the game has ended.
This helper function generates all the possible next moves given one state of the board, which are essentially just all the remaining unconnected adjacent vertices.
This helper function generates all the possible connections between states in the previous layer to states in the current layer.
As shown previously, boards are only unique states if it cannot be transformed into an already existing board state. Thus, I needed a function to filter out the duplicates. In order to do so, I had to maintain an ongoing list of "duplicates." If a possible connection is a unique move, I would add the board and all its equivalents duplicates. If it wasn't a unique move, I needed to add the first connection from inside duplicates into the unique moves list. By iterating over all possible moves in this way, I would be able to only graph unique states.
Here is the above algorithm put into a function.
The following function puts all the previous functions together to generate a new layer of nodes for the multiway graph.
Final Multiway Graph!
Final Multiway Graph!
Here are the first three moves played out in the multiway graph. The game boards can be displayed by hovering over a node.
Even with only three moves, the connections between nodes are complex. Playing out all the moves, there are 570 total unique states with 3094 edges connecting them. It is interesting to note how the graph branches out to its furthest at the 6th move, and then the possible states reduce back to a single board.
Extension: Generalizing to Larger Boards
Extension: Generalizing to Larger Boards
With the existing code, it is easily extensible to larger boards, such as a 4x4 grid. I kept all the functions the same, but had to modify the size of the board and the vertex coordinates.
The first 3 moves of a 4x4 game:
The first 3 moves of a 4x4 game:
The complexity of the multiway graph increases significantly in the 4x4 from the 2x2 grid. After the first three moves, there are 1372 vertices and 3922 edges.
Conclusion
Conclusion
Even with a simple 2x2 dots and boxes grid with 12 total turns, the number of ways to traverse from an empty board to a fully connected board is substantial. In the future, it would be interesting to highlight outcomes in which both players play optimally (ex. avoiding drawing the third line of a square and giving their opponent the point, finishing boxes when possible, and minimizing the sequences of boxes their opponent is able to take in a row). Cases in which the moves made on the board are the same, but the boxes won by each player are different should also be considered as different states. Furthermore, there are many non-rectangular possibilities for dots and boxes boards that can be explored.
References
References
◼
Wolfram, S. (2022, June 8). Games and Puzzles as Multicomputational Systems. Stephen Wolfram Writings. Retrieved July 13, 2023, from https://writings.stephenwolfram.com/2022/06/games-and-puzzles-as-multicomputational-systems/
◼
Wolfram, S. (n.d.). The Relationship between Graphs, and the Multiway Causal Graph. Wolfram Physics Project. Retrieved July 13, 2023, from https://www.wolframphysics.org/technical-introduction/the-updating-process-for-string-substitution-systems/the-relationship-between-graphs-and-the-multiway-causal-graph/
◼
(n.d.). Dots and boxes. Wikipedia. Retrieved July 13, 2023, from https://en.wikipedia.org/wiki/Dots_and_boxes
Acknowledgements
Acknowledgements
I would like to thank my mentor, Jeremy Stratton-Smith, for his constant patience, willingness to help me think through ideas, and hours spent debugging.
CITE THIS NOTEBOOK
CITE THIS NOTEBOOK
Analyzing the game dots and boxes using multiway graphs
by Andrea Li
Wolfram Community, STAFF PICKS, July 13, 2023
https://community.wolfram.com/groups/-/m/t/2963967
by Andrea Li
Wolfram Community, STAFF PICKS, July 13, 2023
https://community.wolfram.com/groups/-/m/t/2963967