Airplane travel has long been praised for its unprecedented convenience and efficiency in linking people and locations all over the world. Air travel demand has increased dramatically in recent years, demonstrating its importance as a preferred form of transportation for millions of people globally.
Furthermore, the accessibility of air travel has played an important part in its increasing demand. Individuals have more options for reaching their intended destinations because of a wide network of airports and airlines.
At the same time, thousands of airplanes fly over our heads 24/7, creating traffic, but they don't get stopped since they fly at different heights, making it a superb air traffic system. For this reason, in some areas, the sky gets densely packed with airplanes.
As my purpose stated, I discovered the busiest high-altitude aviation spots in the United States. As an adherent of disease diagnostics and the convergence of computer science, I attempted to demonstrate how it affects increasing the COPD vulnerability of those places.
Introduction
Introduction
Having always been curious about how things work around me, and finding the correlation between every object has always inspired me to learn math and science. As I live close to the airport and see hundreds of airplanes through my window every day it raised a question in my mind that they are burning gallons of jet fuel every hour and exhausting them into the atmosphere like cars exhaust don’t they also pollute the air with toxic substances that may harm me. I've made some progress in answering this question, and here is what those few sections have produced. I'll study ten airplanes that takes off from each of the 11 airports I chosen selectively around the continental US as part of my research.
Reference Frame: The list of selected airports and The paths of the flights
Reference Frame: The list of selected airports and The paths of the flights
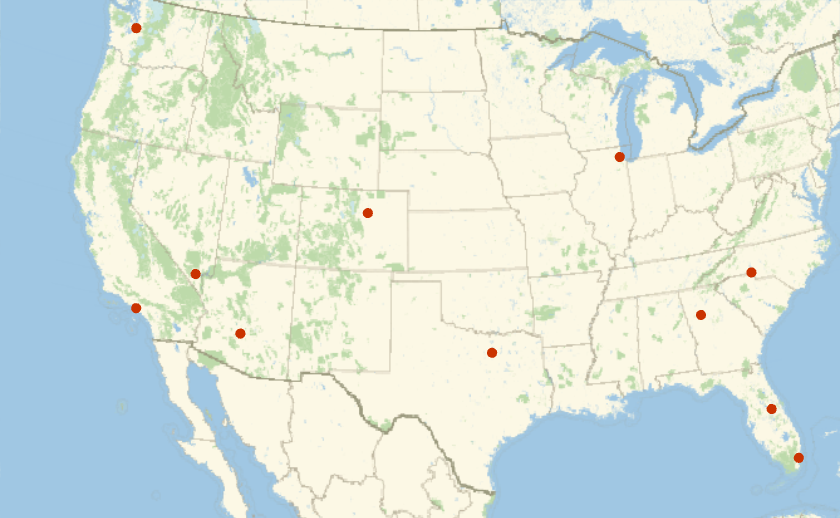
I’ve collected a list of 11 airports decentralized across the continental US and then getting the flight paths of random 10 flights from every airport.
Use Entities to list the 11 airports in the USA:
In[]:=
listOfAirports=,,,,,,,,,,;
Display the locations of these airports:
GeoListPlot[GeoPosition[#["Coordinates"]]&/@listOfAirports]
Out[]=
Randomly choose 10 flights departing on a single day from the listed 11 airports:
In[]:=
flights=Flatten[RandomChoice[FlightData[#All,"Flights",DateObject[{2022,6,6}]],10]&/@listOfAirports];
Use FlightData to get the path for every flight:
In[]:=
flightPaths=FlightData[#,"FlightPath"]&/@flights//Quiet;
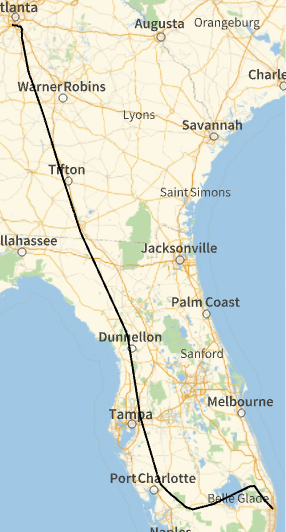
Show the path of the first flight, which departs from Atlanta:
GeoGraphics[GeoPath[flightPaths[[1]]]]
Out[]=
Visualization of the Flight Paths and Density in 2D
Visualization of the Flight Paths and Density in 2D
As a first step before jumping into a 3D visualization, it is important to obtain a better understanding of the flight paths in 2D in order to be able to discern what regions the flights go over as well as what regions are most dense.
The Cropping of the Contiguous/Continental US States map and Taking the flightPaths that are only between the USA
The Cropping of the Contiguous/Continental US States map and Taking the flightPaths that are only between the USA
Preparing the Contiguous/Continental US States map for reference frame.
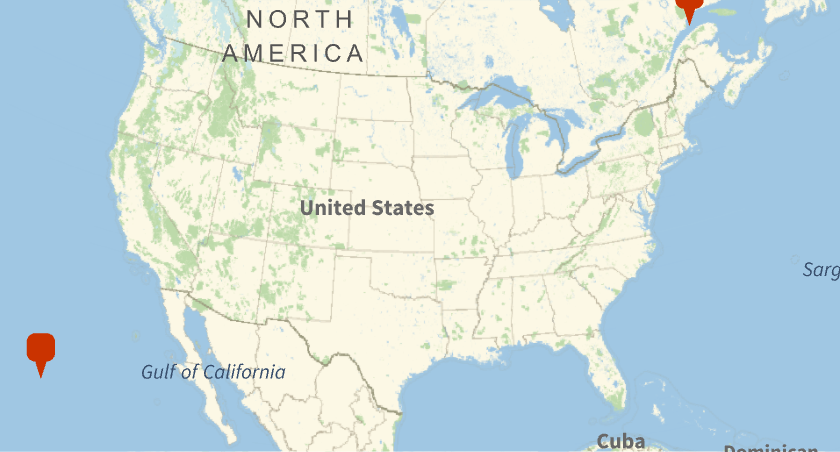
Get the coordinates of the corners of the United States’ bounding box:
usaBounds={#[[1,1]],#[[2,1]]}&@GeoBoundingBox

Out[]=
{{24.5455,-124.733},{49.3844,-66.9499}}
Display this range:
GeoGraphics[GeoMarker/@usaBounds]
Out[]=
Delete points from flightPaths which lie outside the bounds defined above:
In[]:=
usaPaths=DeleteCases[flightPaths,x_/;!(usaBounds[[1,1]]<x[[1]]<usaBounds[[2,1]]&&usaBounds[[1,2]]<x[[2]]<usaBounds[[2,2]]),{-2}];
The Flight Paths on Continental USA Map
The Flight Paths on Continental USA Map
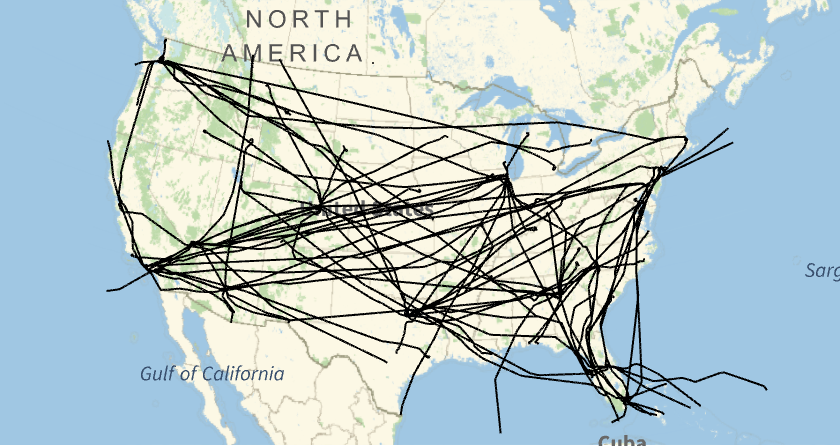
Before calculating path densities, visualize the whole dataset of flight paths.
Plot the flight paths over the country:
GeoGraphicsGeoPath[usaPaths],GeoRange->
Out[]=
Density of the flights in 2D with Marked Airports
Density of the flights in 2D with Marked Airports
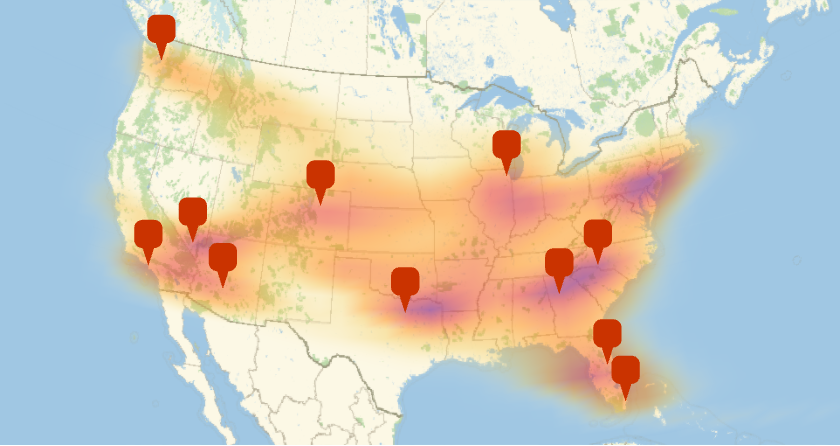
Now, I plot the 2D density of flight paths, which gives a rough idea of airplane hotspots.
Converting the usaPaths into two Dimensions
Converting the usaPaths into two Dimensions
Flatten the airplane paths into a list of points:
twoDimensionalAxisData=GeoPosition[Flatten[usaPaths[[All,1,All,1;;2]],1]]
Out[]=
Making the 2D Density Map
Making the 2D Density Map
Plot the density of the airplane paths, with the airport locations included for reference:
ShowGeoSmoothHistogramtwoDimensionalAxisData,GeoRange,GeoGraphics,GeoMarker[listOfAirports]
Out[]=
Finding the Busiest High-Altitude Airplane Locations in the US
Finding the Busiest High-Altitude Airplane Locations in the US
We can now observe how the flights fly over our heads at various altitudes as they pass overhead. The way they form their courses in a magnificent fashion that creates a very efficient mode of transportation is one of the most efficient modes of transportation.
Because of limited computational capacity, the altitude density is only provided for a limited number of flights, more data would provide higher accuracy maps.
Plotting the Flight Paths in the 3D Space
Plotting the Flight Paths in the 3D Space
Extracting the Latitude, Longitude and Altitude from FlightPath data
Extracting the Latitude, Longitude and Altitude from FlightPath data
Make a list of all the Latitudes, Longitude, and Altitude by using Map on each sublist of USAPaths and compile into a new list:
In[]:=
axisData=Map[{#[[2]],#[[1]],#[[3]]}&,usaPaths[[All,1,All,1;;-2]],{-2}];
Showing the Flight Path as lines in the 3D Space
Showing the Flight Path as lines in the 3D Space
Show flight routes as a collection of paths in three dimensions:
Showing the Co-ordinates of a FlightPath
Showing the Co-ordinates of a FlightPath
Show the flight path points including altitude data:
Visualizing the Flight Paths as a Density Cloud
Visualizing the Flight Paths as a Density Cloud
Scaling the axisData
Scaling the axisData
Scale the altitude down by a factor of 1000:
Creating the Density Cloud of Flight path Co-ordinates
Creating the Density Cloud of Flight path Co-ordinates
Make the density cloud for the points in 3D:
Cropping the Map of the Continental US based on the Co-ordinates of the Density Cloud
Cropping the Map of the Continental US based on the Co-ordinates of the Density Cloud
Pull an image of the United States underneath the range of data:
Texture a polygon with this image data:
Visualizing the Flight Density Cloud on the top of US Map
Visualizing the Flight Density Cloud on the top of US Map
Combine the polygon underneath the density plot to give geographic reference to the data:
Chronic Obstructive Pulmonary Disease
Chronic Obstructive Pulmonary Disease
COPD (chronic obstructive pulmonary disease) is a progressive lung illness that affects millions of people worldwide, including a sizable proportion in the United States. COPD is distinguished by reduced airflow, chronic inflammation, and poor lung function. While smoking is still the largest cause of COPD, air pollution, particularly emissions from cars and planes, is still a substantial contributor. This document investigates the impact of air pollution from vehicles and planes on the vulnerabilities of COPD patients in the United States, supported by research references.
Air Pollution from Planes and Cars
Air Pollution from Planes and Cars
Planes
Planes
Pollutants emitted by aircraft include carbon dioxide (CO2), sulfur oxides (SOx), nitrogen oxides (NOx), and particulate matter (PM). These pollutants have an impact on both local and global air pollution. at-ground emissions have a greater impact on air quality at airports and neighboring towns during the landing and departure phases.
Cars
Cars
Vehicle emissions contribute significantly to air pollution, including particulate matter (PM), nitrogen oxides (NOx), and volatile organic compounds (VOCs). Emission levels are affected by factors such as vehicle age, fuel type, and traffic congestion. Pollutants released by automobiles can enter the respiratory system and cause inflammation and damage to lung tissue.
Impact on Vulnerabilities of COPD
Impact on Vulnerabilities of COPD
Exacerbation of Symptoms
Exacerbation of Symptoms
Air pollution from automobiles and planes can aggravate COPD symptoms and increase the frequency and severity of respiratory discomfort. According to research, excessive levels of air pollution can cause COPD exacerbations, resulting in hospitalizations and emergency department visits.
Disease Progression
Disease Progression
When people with COPD are exposed to air pollution over an extended period of time, their lung function declines more quickly. Pollutant-induced inflammation can hasten the course of COPD by increasing oxidative stress and lung damage. Furthermore, comorbidities including cardiovascular disorders, which further worsen the prognosis for those with COPD, might develop as a result of air pollution.
Increased Mortality Risk
Increased Mortality Risk
Patients with COPD have a higher chance of dying due to air pollution from vehicles and aircraft. Fine particulate matter (PM2.5) and other pollutants can have a negative impact on cardiovascular and respiratory health, increasing the risk of premature death in those with COPD.
Conclusion and Future Applications
Conclusion and Future Applications
In this project, I depicted the busiest high-altitude airplane landing sites in the United States. These code cells can assess vast amounts of data. Airplane density clouds can be used for a variety of purposes. My key future goal is to determine the extent to which aviation fuel exhaust increases the vulnerability of COPD disease. Currently, aircraft causes around 3% of air pollution in the United States, with the majority of air pollution created by automobiles and industries, but in the future, we may replace traditional cars with electric cars, thereby reducing the massive amount of pollution caused by cars. The technology to use commercial electric planes has not yet been developed, and jet fuel exhaust will be a major source of air pollution. Because of its convenience, commercial aviation is growing at an exponential rate. Whereas airplane-density clouds can be employed to decentralize clouds, enhance air quality in particle regions, and assist reduce COPD vulnerability.
Acknowledgements
Acknowledgements
1. Everyone in World Science Scholars (James Bourtis, Gillian Small, Brian Greene, Robin Bendiak, Robert Bennet and others)
2. Kegan Allen (Mentor)
3. Everyone in Wolfram Summer Research Program (Rory, Sam, Theo, Karan, Megan, Eryn, and others)
2. Kegan Allen (Mentor)
3. Everyone in Wolfram Summer Research Program (Rory, Sam, Theo, Karan, Megan, Eryn, and others)
Research References
Research References
1. Dominici, F., Peng, R. D., Bell, M. L., et al. (2006). Fine particulate air pollution and hospital admission for cardiovascular and respiratory diseases. JAMA, 295(10), 1127-1134.
2. Ko, F. W., Hui, D. S., & Air Pollution and COPD Advisory Group of the Hong Kong Thoracic Society. (2012). Air pollution and chronic obstructive pulmonary disease. Respirology, 17(3), 395-401.
3. Pérez-Padilla, R., Schilmann, A., Riojas-Rodríguez, H., et al. (2013). Lung function and chronic exposure to air pollution: a cross-sectional analysis of NHANES data. Thorax, 68(7), 634-640.
4. Control of Air Pollution from Airplanes and Airplane Engines: GHG Emission Standards and Test Procedures - Final Rulemaking (https://www.epa.gov/regulations-emissions-vehicles-and-engines/control-air-pollution-airplanes-and-airplane-engines-ghg)
5. Rice, M. B., Ljungman, P. L., Wilker, E. H., et al. (2013). Long-term exposure to traffic emissions and fine particulate matter and lung function decline in the Framingham Heart Study. American Journal of Respiratory and Critical Care Medicine, 188(3), 338-346.
6. Schikowski, T., Schaffner, E., Meier, F., et al. (2015). Improved air quality and attenuated lung function decline: modification by obesity in the SAPALDIA cohort. Environmental Health Perspectives, 123(4), 1036-1042.
CITE THIS NOTEBOOK
CITE THIS NOTEBOOK
Finding high density airplane locations in the US and its impact on COPD
by Mahir Labib
Wolfram Community, STAFF PICKS, July 13, 2023
https://community.wolfram.com/groups/-/m/t/2965416
by Mahir Labib
Wolfram Community, STAFF PICKS, July 13, 2023
https://community.wolfram.com/groups/-/m/t/2965416