This project develops two interrelated tools for the generation and exploration of chemical space networks from molecule data, a wolfram language superfunction ChemicalSpaceNetwork that generates chemical space graphs from imported data and includes options for a wide range distance functions and molecular fingerprints while integrating with the MolecularFingerprints package, and a graphical user interface designed to be used with the superfunction that easily enables the analysis of complex chemical network data. Future work in this area includes updates to the interface, as well as applications in random matrix theory and graph neural networks to areas of medicinal chemistry, cheminformatics and drug discovery.
Introduction and Background
Introduction and Background
One of the most rapidly emerging areas of cheminformatics and medicinal chemistry is the use of graphs and networks to study the “chemical space” of bio active molecules. While graph based methods have been used extensively for the study of single molecules and reaction networks, graphs of chemical space networks (CSNs) are a relatively recent but powerful addition in studying the relationship of structure and function for a large ensemble of compounds. Chemical space networks use feature extraction to represent molecules as bit vectors, called fingerprints, in some higher dimensional space, and then build graphs by considering some distance function applied to this collection of features. The vertices of this graph are the molecules themselves and the edges are weighted by the distance between molecules, with some threshold chosen between zero and 1 such that edges are only drawn between vertices having distance less than or equal to the threshold.
In Chemical space networks: a powerful new paradigm for the description of chemical space. J Comput Aided Mol Des 28, 795–802 (2014), Maggiora et. al discuss three advantages to the study of chemical space networks over traditional paradigms in chemistry:
◼
CSNs naturally capture the discrete structure of chemical space and the relationships between molecules within that space
◼
CSNs naturally abstract statistical analysis of large groups of chemical libraries
◼
The prevalence of graph theoretic constructs in other fields means there already exists a diverse collection of efficient graph analysis algorithms that could yield new and unexpected insights into the structures of chemical spaces.
The Wolfram Language already contains existing tools for the analysis of chemical data and Graphs and Networks. The encoding of Molecule data is handled by Molecule objects, there is also an extensive library in the Wolfram Paclet and function repository which adds to the chemistry functionality in WL. Graphs and network analysis are also built directly into WL with an extremely broad range of functionality. Given these features of WL, we seek to implement functionality for the generation and exploration of CSN’s directly in WL.
Molecular Fingerprints
Molecular Fingerprints
Molecules in WL are represented by Molecule[] objects. If we have some Molecule, we can use the MoleculeFingerprints paclet to generate a fingerprint for that object. Fingerprints are represented as NumericArray’s of 1’s and 0’s.
The choice of fingerprints for a given molecule or library of molecules is extremely problem and context dependent. Here we describe the default option used by ChemicalSpaceNetwork[] when generating fingerprints - Topological or “RDKit” fingerprints, although the options for fingerprints are detailed in the function repository submission.
Topological Fingerprints
Topological Fingerprints
In[]:=
molecule=Molecule["C[C@H](Cc1c[nH]c2c1ccc(c2)O)N"]
Out[]=
Molecule

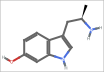
Then the Topological Fingerprint of that molecule can be determined by calling TopologicalFingerprint[]
In[]:=
fingerprint=TopologicalFingerprint[molecule]
Out[]=
NumericArray
TopologicalFingerprint[] works by enumerating all subgraphs within some size range and then hashing each substructure to an integer. The hash for each subgraph is determined by the atomic numbers, aromaticity and bond types in each subgraph. For more information see the paclet documentation. Other fingerprints can be passed directly to ChemicalSpaceNetwork function using the “Fingerprint” option.
Molecular Distance
Molecular Distance
After computing a pair of fingerprints, we want to compute the distance between them. We can do this using different distance measures which can be specified in the function using the “DistanceFunction” option. Any valid distance function between two bit vectors is accepted, similar to the choice of Fingerprint choosing a valid distance function is a context dependent problem - here we describe the default and most common - the Jaccard dissimilarity:
Jaccard Dissimilarity
Jaccard Dissimilarity
f(A,B)=A·B 2 A 2 B |
Which is equivalent to the following, where is the number of pairs of elements in and equal to and respectively:
n
ij
A
B
i
j
( n 10 n 01 n 11 n 10 n 01 |
Graph Generation
Graph Generation
Input Pipeline
Input Pipeline
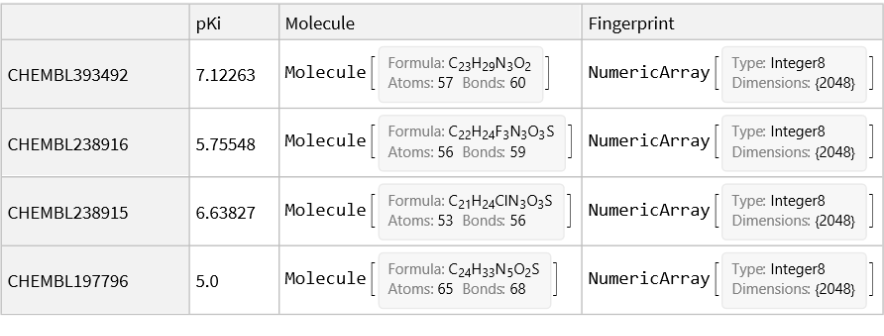
We start from a sample dataset of inhibitors to the D5 Dopamine Receptor generated from the ChEMBL database. The dataset includes 345 compounds represented as SMILES strings and biological data in the form of the inhibition coefficient Ki, as well as associated ChEMBL data. The data is imported and parsed into a Dataset[] of associations between ID’s to SMILES Strings and pKi. The first four rows are shown below:
In[]:=
dataset=generateDatasetBio["/Users/joshuakhorsandi/Documents/Summer Research - 2023/WSS 2023/Chem Space - #225/ChemicalSpaceNetworks/ChemicalSpaceNetworks/Data/D5Activities.csv","pKi"][[;;4]]
Out[]=

We convert the SMILES strings into Molecule objects, and pass the Molecule objects to the Option set for “Fingerprint”, here we use the default option and split the dataset for viewing purposes:
In[]:=
fingerprintData=assignFingerprints[dataset];fingerprintData[All,"Smiles"]
Out[]=

In[]:=
fingerprintData[All,KeyDrop["Smiles"]]
Out[]=
Graph Generation
Graph Generation
Once we have the fingerprint dataset we can compute the distances between the bit vectors that represent each of the Molecule objects. We use a ParallelMap to compute the expensive pairwise distance calculations for each molecule pair. We first apply a KeyValueMap between ChEMBL ID’s and Fingerprints:
In[]:=
fingerprints=KeyValueMap[{#1,#2["Fingerprint"]}&,fingerprintData]
Out[]=
We then generate the pairwise edge data for each Molecule object. For each pair of Molecules we take their fingerprint data and evaluate a distance function over their two bit vectors . We map to this distance the UndirectedEdge[] between the two ChEMBL ID’s representing each molecule. The computation is done in parallel to decrease computation strain over large datasets of molecules.
In[]:=
edges=ParallelMap[UndirectedEdge[Sequence@@First/@#]->N@*JaccardDissimilarity@@Last/@#&,Subsets[Normal[fingerprints],{2}]]//Association
Out[]=
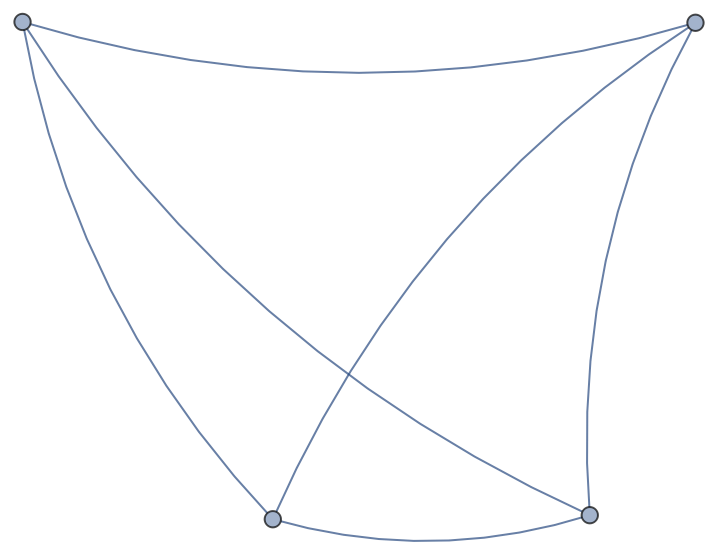
CHEMBL393492CHEMBL2389160.698089,CHEMBL393492CHEMBL2389150.696169,CHEMBL393492CHEMBL1977960.596685,CHEMBL238916CHEMBL2389150.0893417,CHEMBL238916CHEMBL1977960.77887,CHEMBL238915CHEMBL1977960.773657
The final graph is generated by selecting edges that have a distance less than or equal to some cutoff value. The EdgeWeght of the generated Graph object is given by the distance computed in the previous step. Here we use a cutoff of 1 as an example.
Because the final graphs are usually large and intricate, the default option set in the function is to use the “Gravity” embedding. This layout is a simplified version of the Fruchterman-Reingold embedding method. See -
https://doi.org/10.48550/arXiv.1201.3011 for more information. Essentially the graph is drawn where vertices are weights with charge and edges connecting them are springs; the layout then minimizes the gravitational, mechanical and electric strain between vertices. The small sample graph for the four example molecules is shown below:
https://doi.org/10.48550/arXiv.1201.3011 for more information. Essentially the graph is drawn where vertices are weights with charge and edges connecting them are springs; the layout then minimizes the gravitational, mechanical and electric strain between vertices. The small sample graph for the four example molecules is shown below:
In[]:=
Select[edges,#<=1&]//Keys//Graph[Tooltip/@Union@@List@@@#,#,GraphLayout->"GravityEmbedding"]&
Out[]=
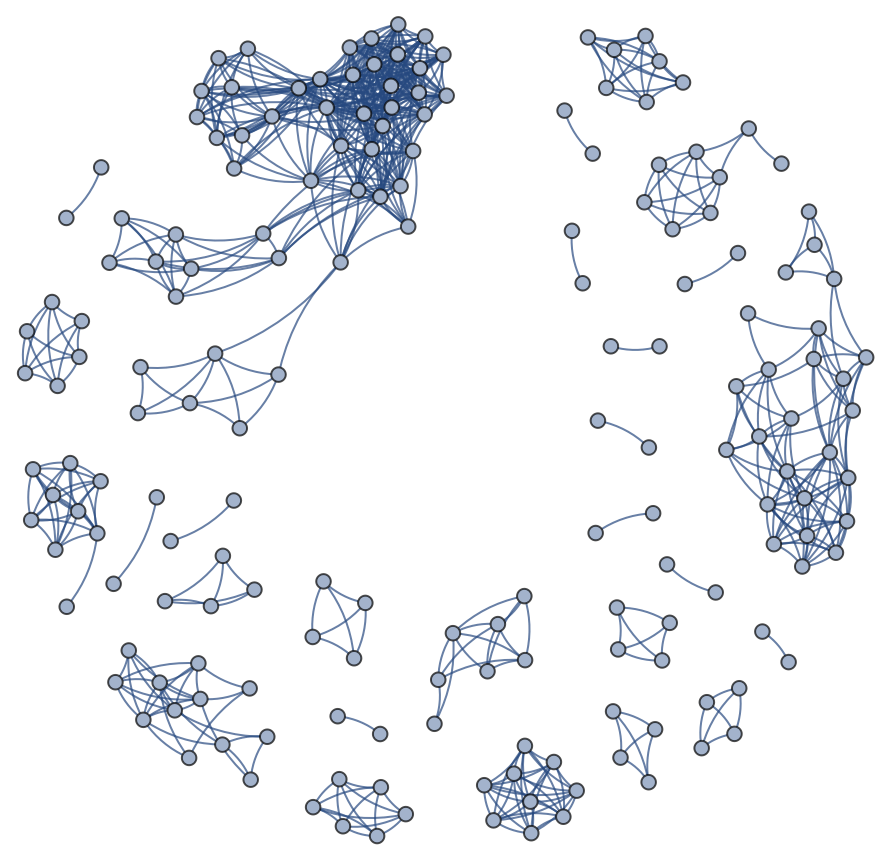
The graph for the entire D5 Activities dataset is shown here, with a cutoff of 0.5 chosen:
Out[]=
We can also use the provided Ki data to color the graph vertices:
The ChemicalSpaceNetwork[] Function and GUI
The ChemicalSpaceNetwork[] Function and GUI
The function ChemicalSpaceNetwork[] submitted to the function repository generates and simplifies the above pipeline into a single WL superfunction with options that customize the input of molecule data, as well as the fingerprints, distance functions, biological data and graph drawing. Complete documentation and examples can be found on the Wolfram Function Repository Submission.
We also include a GUI which allows for the exploration of chemical space networks by integrating common functionality that users would use to analyze graphs generated from data. The input to the UI is any graph generated by calling ChemicalSpaceNetwork[] on a dataset. The graph itself is generated from the ChemicalSpaceNetwork function, and inherits the options passed to that function - for example if a different distance function was used then the graph displayed in the GUI would use the supplied distance function. For more information on the function itself, see the Wolfram Function Repository submission.
The D5 Receptor Dataset - Sample Analysis
The D5 Receptor Dataset - Sample Analysis
Here we present a sample analysis using the generated D5 receptor inhibitor network discussed above using the user interface. First the graph and fingerprints generated above are loaded into the UI:
Subgraph Workflows
Subgraph Workflows
We can analyze a specific community of molecules in the global graph by shift clicking on the graph to select all the connected components of any vertex. We choose the community containing the molecules with the greatest pKi values:
And then use the ‘Subgraph menu to generate and display the selected subgraph, we also use the ‘Switch Embedding’ menu to change the graph layout to ‘Spring Electrical’ to study the smaller, connected graph, additionally we overlay the biological data for the cluster:
The subgraph contains interesting information about the relationship between biological function and molecular structure. Vertices that are near to each other have high structure similarity and many of them have similar biological data. We could also export data such as the subgraph itself, its weighted adjacency matrix and eigenvalues. As well as other graph measures such as communities or connected components - both of which can also be applied as highlighting on the graph itself.
By using the ‘Representative Molecule’ menu we can highlight and generate a plot of the Molecule with the greatest Degree Centrality in a a subgraph as a separate window. Here we show the representative molecule plot for the entire network - CHEMBL 62:
Clearly, there are quantifiable structural similarities between the two molecules, and we could investigate the relationships between both of these molecules to each other, or to other molecules in the network, or to other candidates for D5 receptor antagonists to find common structural similarities required for the inhibition of the D5 receptor.
A remarkable additional result is found when we compare the degree centrality representative to Halobenzazepine, a compound used to compare pathway’s of drug overdose of d-amphetamine, methamphetamine, and cocaine (see Derlet et. al The Effect of SCH 23390 Against Toxic Doses of Cocaine, d-Amphetamine and Methamphetamine ". Life Sciences. 47 (9): 821–827 (1990)):
The molecular similarity between Halobenzazepine and the drug representative is relevant because Halobenzazepine corresponds almost exactly to the representative molecule for the network, despite initially being tested as a D1/D2 dopamine receptor antagonist. This topological similarity in the distance between Halobenzazepine and other D5 antagonists in the chemical network is a representation of the interconnectedness of the D5 receptor to the D1/D2 receptor family, this connection however can be shown without any a priori knowledge of the receptors being interrelated.
Finding Biologically Active Molecule Structures - Cyclin Dependent Kinase Inhibitors
Finding Biologically Active Molecule Structures - Cyclin Dependent Kinase Inhibitors
One potential application of the user interface is aiding drug discovery by clustering similar molecules into subgraphs and layering biological activity data over the graph vertices. In this example we import into the user interface a network of inhibitors to a protein family of cyclin dependent kinases. Kinases are enzymes which phosphorylate proteins and CDKs were first discovered as part of their role in the regulation of the cell cycle - see https://genomebiology.biomedcentral.com/articles/10.1186/gb4184 for more information. They have received considerable research speculation over their role as potential drug candidates for cancer therapy.
Data Collection
Data Collection
Using the ChEMBL database, we search for Targets: Cyclin Dependent Kinase’s and filter for Homo Sapiens. After applying the following filters: “BAO: Assay Format”, “Source: Scientific Literature”, “Molecular Weight: 400-600”, “Standard Type: IC50” we are left with a dataset of ~450 molecules and associated ChEMBL data, including biological data in the form of IC50.
Determining Threshold Value, Graph and Fingerprint Generation, Exporting Data
Determining Threshold Value, Graph and Fingerprint Generation, Exporting Data
We call the function ChemicalSpaceNetwork on the data, generating the fingerprint data and the edge data, we set the threshold to some arbitrary value 0.5 initially
We can gather the Topological distances:
We can calculate the edge density of the network at different Topological similarities to determine values above which the graph data becomes meaningless (as every component would be connected to every component):
Regenerating the network and drawing the graph with a cutoff of 0.31 (we use 0.31 here because we are inter converting between similarity and distance) we have
We now export the graph and the fingerprint data to use in the UI later:
Investigation in the UI
Investigation in the UI
We can import the files and use them in the UI by setting $graph to the exported graphCDK and $fingerprints to the exported $fingerprints, lastly we set “BioType” to IC50 in the GUI Dynamic Module. The notebook containing the GUI Analysis is uploaded to the accompanying github repository for this project under “CDK Analysis.nb”
After loading the graph, we color the vertices by the biological data (pIC50) to find clusters with greater bio activity
IC50 represents the concentration of a molecule required for 50% inhibition of the underlying target, therefore the greater the pIC50 the better inhibitor a molecule is. In one of the graph communities, there is a cluster of vertices with pIC50 between 8 and 10, we use the select vertices tool to select vertices in that cluster with and generate a subgraph using the subgraph menu, the embedding is switched to SpringElectrical:
Again we can see the connections between structure and biological function, with some notable outliers that we can investigate. We can highlight and select and plot the molecule with the greatest degree centrality:
We can also plot two outliers, CHEMBL 5086711 is an outlier due its unusually low biological activity:
and CHEMBL 5093012 is an outlier because of its structural difference to the rest of the subgraph in spite of its high pKi, indicated by its distance from the main cluster:
Now consider the phase II drug Seliciclib currently being developed by Cyclacel. The drug has been shown to inhibit the two A and E CDK complexes as well as CDK7 and CDK9 (see Hilal et. al, Discovery and Development of Seliciclib, J. Biotech (2015)). The structure of Seliciclib can be generated from its SMILES string:
Seliciclib is a 2,6,9 purine analog whose structural similarity between the drug and the influential vertex from the cluster is striking. Similarly, the distance outlier CHEMBL 5093012 preserves features of the biologically active Seliciclib while the structurally similar yet biologically inactive outlier preserves aspects that are potentially irrelevant to CDK binding. This preliminary analysis has already demonstrated common structural features of CDK inhibitors and there is significant room for further analysis.
Future Work
Future Work
UI Improvements
UI Improvements
There are areas of the UI that future work could improve significantly, currently selecting influential vertices is only possible using degree centrality, which is a relatively basic measure of vertex influence, the implementation of other graph centrality measures could illuminate other features of the dataset.
Another notable improvement would be ensuring the Annotation system does not collide with the BioData legended graph. Currently “Display Bio Data” generates a legended graph that has to then have First applied to it to return the normal graph. This has a high potential for causing bugs and unexpected behavior.
Random Matrix Theory
Random Matrix Theory
Recent articles (Kothiyal, M., Kumar, S. & Sukumar, N. Investigation of chemical space networks using graph measures and random matrix theory. J Math Chem 60, 891–914 (2022)) have studied the application of random matrix theory (RMT) to chemical space networks.
In this approach complex systems are modeled using an ensemble of random matrices, with statistics for the system drawn from the eigenvalues. These statistics are then used to draw inferences about the state of the system as a whole. For an introduction to RMT see Livan, G., Novaes, M., & Vivo, P. (2018). Introduction to random matrices—Theory and practice (Vol. 26).
Wolfram Mathematica already has a wide ensemble of tools that enable the study of random matrix statistics, including built in matrix ensembles (eg. Gaussian, Circular) and the derived matrix statistics using MatrixPropertyDistribution. The ChemicalSpaceNetwork function and UI enables the integration of RMT techniques and chemical networks directly in Mathematica. Future work could explore larger datasets and eigenvalue measures using these tools
Graph Neural Networks
Graph Neural Networks
Graph neural networks are neural network systems which allow for the powerful paradigm of neural networks to operate naturally on graph data using convolutions. For an introduction to graph neural networks see the series of posts https://distill.pub/2021/understanding-gnns/. While graph neural network approaches have been studied extensively to analyze the graph structure of individual molecules (Reiser, P., Neubert, M., Eberhard, A. et al. Graph neural networks for materials science and chemistry. Commun Mater 3, 93 (2022), Jiang, D., Wu, Z., Hsieh, CY. et al. Could graph neural networks learn better molecular representation for drug discovery? A comparison study of descriptor-based and graph-based models. J Cheminform 13, 12 (2021)), there are has been very few investigations of applying GNN’s to chemical space graphs. This is an area of wide open discovery that could lead to new insights about entire drug libraries and complex relationships between molecules.
Acknowledgements
Acknowledgements
This work would not have been possible without the guidance of Robert Nachbar from Wolfram Research, who helped at every stage of the projects development. Additionally I would like to thank Jason Biggs in his work developing the MolecularFingerprints paclet and the entire WSS team who provided lectures and assistance in design and implementation. Lastly I would like to thank the other members of the WSS who listened to code ideas and contributed their ideas over dinner conversation and walks through Waltham.
Implementation
Implementation
The code for the Dynamic sections, as well as the complete code is hosted on the associated project github repository, it is recommended to use either the function repository or the github, the code included here is for completion purposes:
https://github.com/JooshK/ChemicalSpaceNetworks
https://github.com/JooshK/ChemicalSpaceNetworks
CITE THIS NOTEBOOK
CITE THIS NOTEBOOK
Chemical space networks from molecule data
by Joshua Khorsandi
Wolfram Community, STAFF PICKS, July 12, 2023
https://community.wolfram.com/groups/-/m/t/2958091
by Joshua Khorsandi
Wolfram Community, STAFF PICKS, July 12, 2023
https://community.wolfram.com/groups/-/m/t/2958091